Correlation and Covariance in R
Here, we discuss the Pearson’s correlation coefficient, and covariance, including deriving their values and matrices in R.
The Pearson’s
correlation coefficient value or matrix can be derived in R with the
cor() function, and the covariance value or matrix can be
derived in R with the cov() function. Both functions are
from the "stats" package in the base
version of R.
The Pearson’s correlation coefficient, which takes values from -1 to 1, measures the linear relationship between two variables. The more the scatter plot of the two variables fits a straight line, the higher the absolute value of the Pearson’s correlation coefficient.
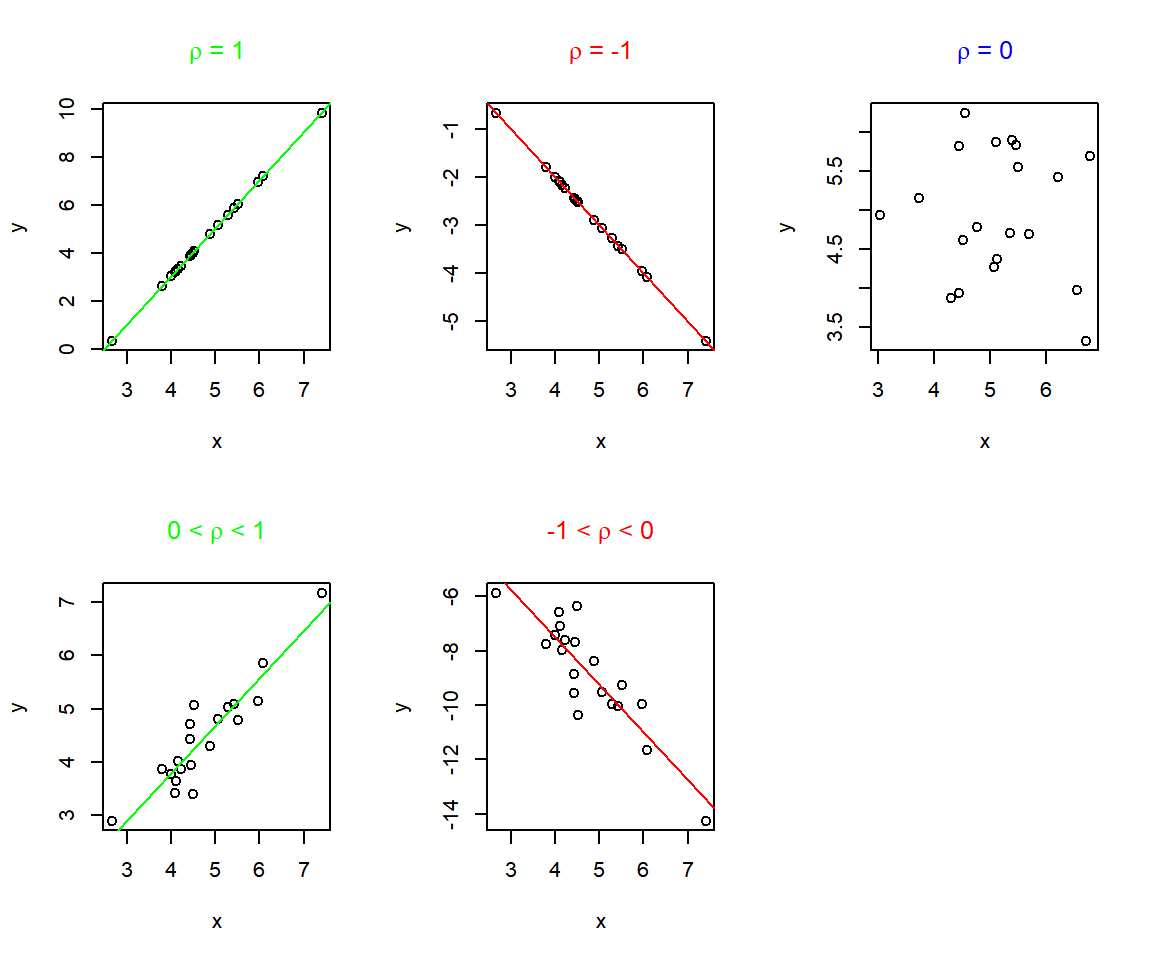
Illustration of Pearson’s Correlation Coefficient Values
See Pearson’s correlation coefficient test for statistical test on the Pearson’s correlation coefficient.
| Function | Usage |
cor() |
Correlation coefficient value or matrix |
cov() |
Covariance value or matrix |
1 Deriving a Pearson’s Correlation Value or Matrix in R
Derive correlation value:
# Enter the data by hand

data_x = c(19.6, 18.0, 18.6, 20.4, 19.4, 19.5)
data_y = c(18.4, 19.2, 15.4, 20.3, 20.6, 19.8)

# Value
cor(data_x, data_y)
[1] 0.4765177The Pearson’s correlation between data_x and data_y is 0.477.
Derive correlation matrix:
Using the trees data from the "datasets" package.
  Girth Height Volume
1   8.3     70   10.3
2   8.6     65   10.3
3   8.8     63   10.2
4  10.5     72   16.4
5 10.7 81 18.8 Girth Height Volume
Girth 1.0000000 0.5192801 0.9671194
Height 0.5192801 1.0000000 0.5982497
Volume 0.9671194 0.5982497 1.0000000The diagonals are 1 because they are the correlation between the variables themselves, while the non-diagonals are the correlation between the different pairs of variables.
The correlation between:
- "Girth" and "Height" is 0.5193.
- "Girth" and "Volume" is 0.9671.
- "Height" and "Volume" is 0.5982.
2 Deriving a Covariance Value or Matrix in R
Derive covariance value:
# Enter the data by hand

data_x = c(18.2, 20.0, 18.5, 16.7, 19.1, 22.0)
data_y = c(18.4, 19.2, 15.4, 20.6, 20.6, 19.8)

# Value
cov(data_x, data_y)
[1] 0.272The covariance between data_x and data_y is 0.272.
Derive covariance matrix:
Using the trees data from the "datasets" package.
  Girth Height Volume
1   8.3     70   10.3
2   8.6     65   10.3
3   8.8     63   10.2
4  10.5     72   16.4
5 10.7 81 18.8 Girth Height Volume
Girth 9.847914 10.38333 49.88812
Height 10.383333 40.60000 62.66000
Volume 49.888118 62.66000 270.20280The diagonals are the variance of the variables, while the non-diagonals are the covariance between the different pairs of variables.
The variance of "Girth" is 9.848, "Height" is 40.6, and "Volume" is 270.203.
The covariance between:
- "Girth" and "Height" is 10.3833.
- "Girth" and "Volume" is 49.8881.
- "Height" and "Volume" is 62.66.
3 Formulas for Sample Covariance and Sample Pearson’s Correlation Coefficient in R
Sample Covariance Formula:
\[cov(x,y) = \frac{\sum ^n _{i=1}(x_i - \bar{x})(y_i - \bar{y})}{n-1}.\]
Sample Pearson’s Correlation Formula:
\[r_{x,y} = \frac{\sum ^n _{i=1}(x_i - \bar{x})(y_i - \bar{y})}{\sqrt{\sum ^n _{i=1}(x_i - \bar{x})^2} \sqrt{\sum ^n _{i=1}(y_i - \bar{y})^2}}.\] \(\sum\) is the summation sign,
the \(x_i's\), and the \(y_i's\) are the sample data values,
\(\bar x\) and \(\bar y\) are the sample means of the \(x_i's\) and the \(y_i's\) respectively, and
\(n \in \{3, 4, 5 ...\}\) is the number of pairs in the sample.
4 Multiple Correlation Plot in R
Using the trees data from the "datasets" package above.
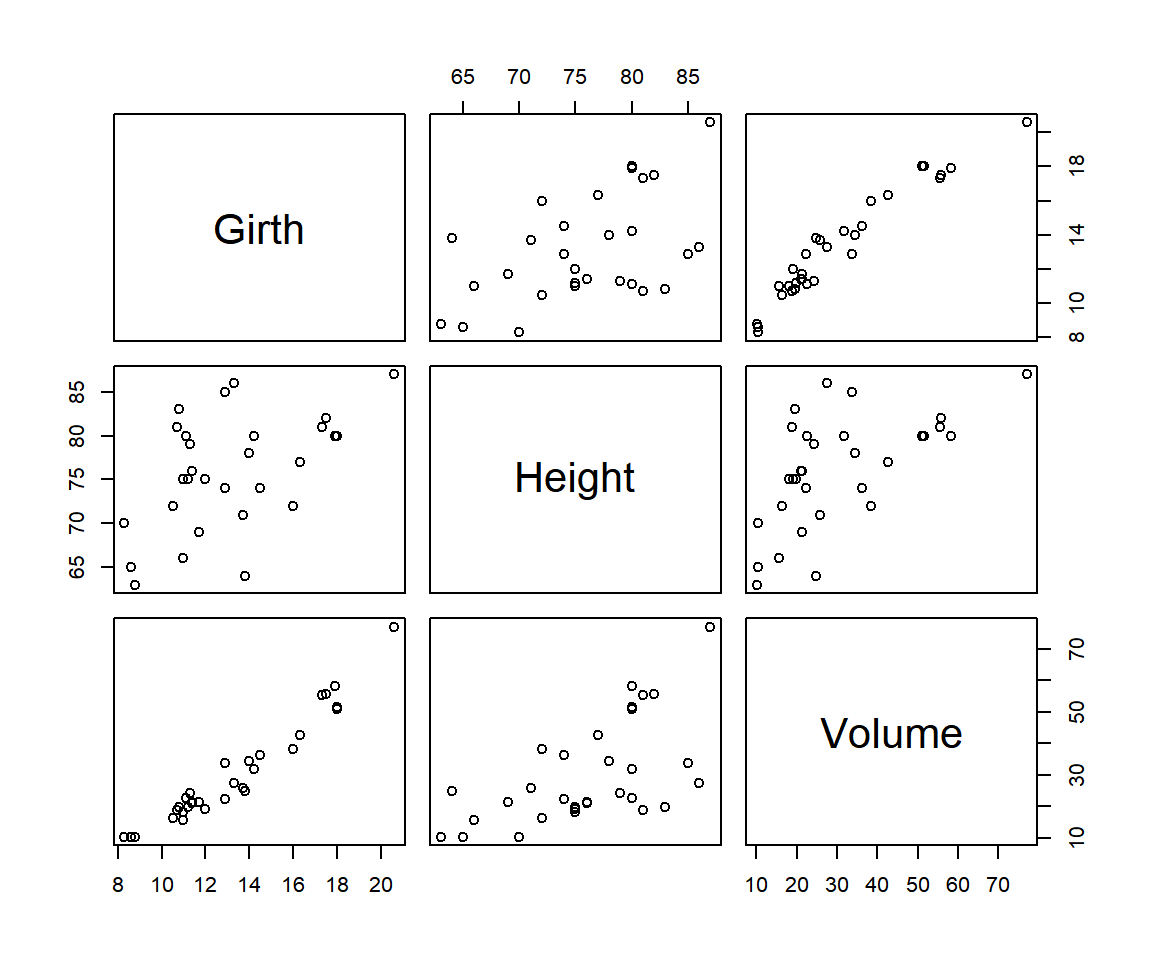
Multiple Scatter Plot for Correlation Analysis in R
Consistent with the correlation coefficients above, we can see that "Girth" and "Volume" are the most correlated pair, while "Girth" and "Height" are the least correlated.
# With some customization
plot(trees,
     main = "Multiple Scatter Plot for Correlation Analysis in R",
     cex = 1.5, cex.main = 1.25, cex.axis = 1.4,
     font = 2,
     col = "limegreen", col.axis = "red")
Multiple Scatter Plot for Correlation Analysis in R
The feedback form is a Google form but it does not collect any personal information.
Please click on the link below to go to the Google form.
Thank You!
Go to Feedback Form
Copyright © 2020 - 2026. All Rights Reserved by Stats Codes