Legends on Plots in R
Here, we discuss legends on plots & charts in R, with examples of legend positions, titles, colors & font sizes, and horizontal legends.
1 Legend Positions in R
Legends can be positioned anywhere on your plot by using the (x, y) co-ordinate argument or placing them directly in one of the 4 corners, 4 sides or in the center by setting the position as one of "topleft", "left", "bottomleft", "top", "center", "bottom", "topright", "right" and "bottomright". See some examples below.
plot(10, 10, type="n")
# Add "topleft" legend
legend("topleft", c("Top Left", "Legend Example"))

plot(10, 10, type="n")
# Add "bottom" legend
legend("bottom", c("Bottom", "Legend Example"))

plot(10, 10, type="n")
# Add "bottomright" legend
legend("bottomright", c("Bottom Right", "Legend Example"))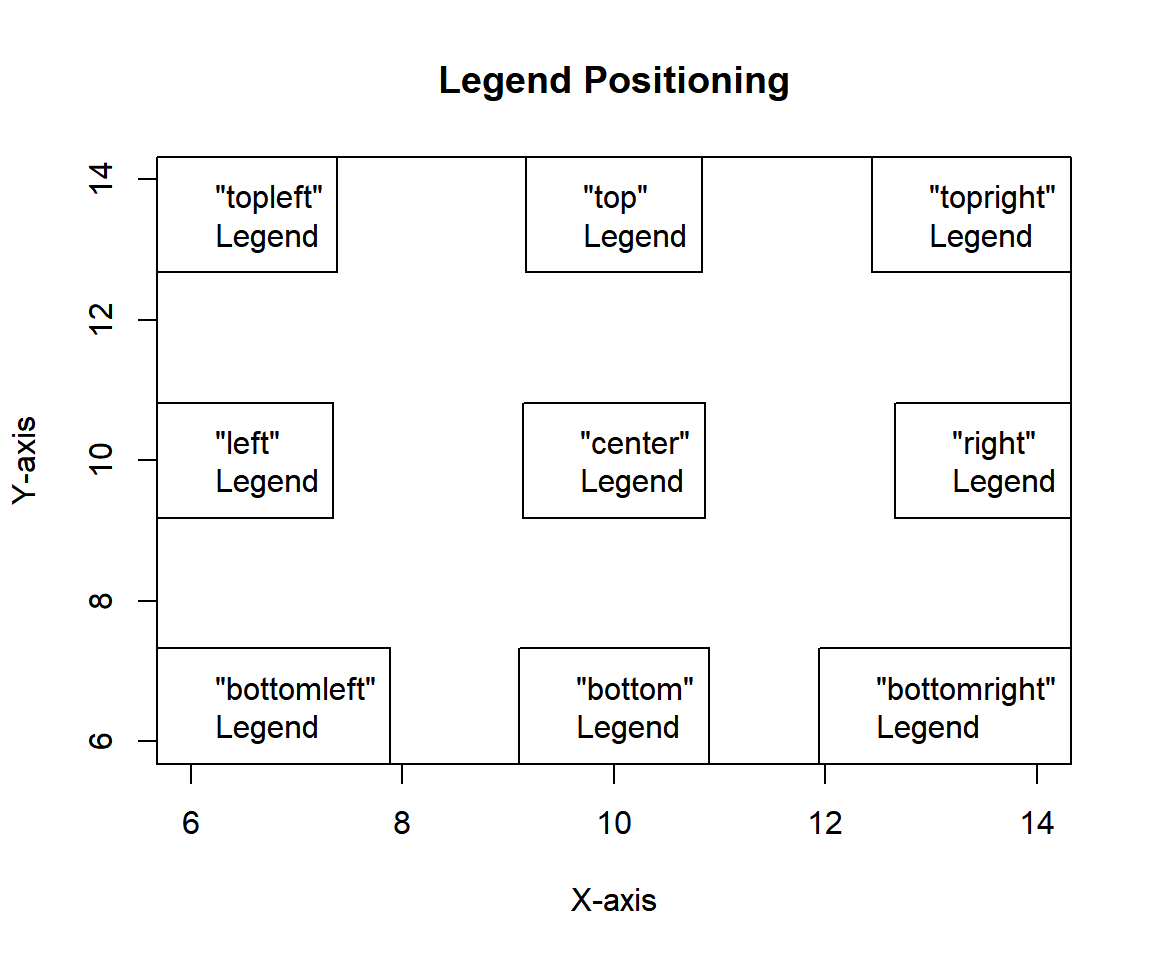
Example of Legend Positions in R
You can further inset the edge or point of your legend that is touching the plot area you specified towards the center of the plot. The argument 0.5 will put the edge or point in the center. See examples below.
plot(10, 10, type="n")
legend("topright", c("Top Right", "Inset = 0.15"), inset = 0.15)

plot(10, 10, type="n")
legend("bottom", c("Bottom", "inset = 0.1"), inset = 0.1)

plot(10, 10, type="n")
legend("bottomleft", c("Bottom Left", "inset = 0.05"), inset = 0.05)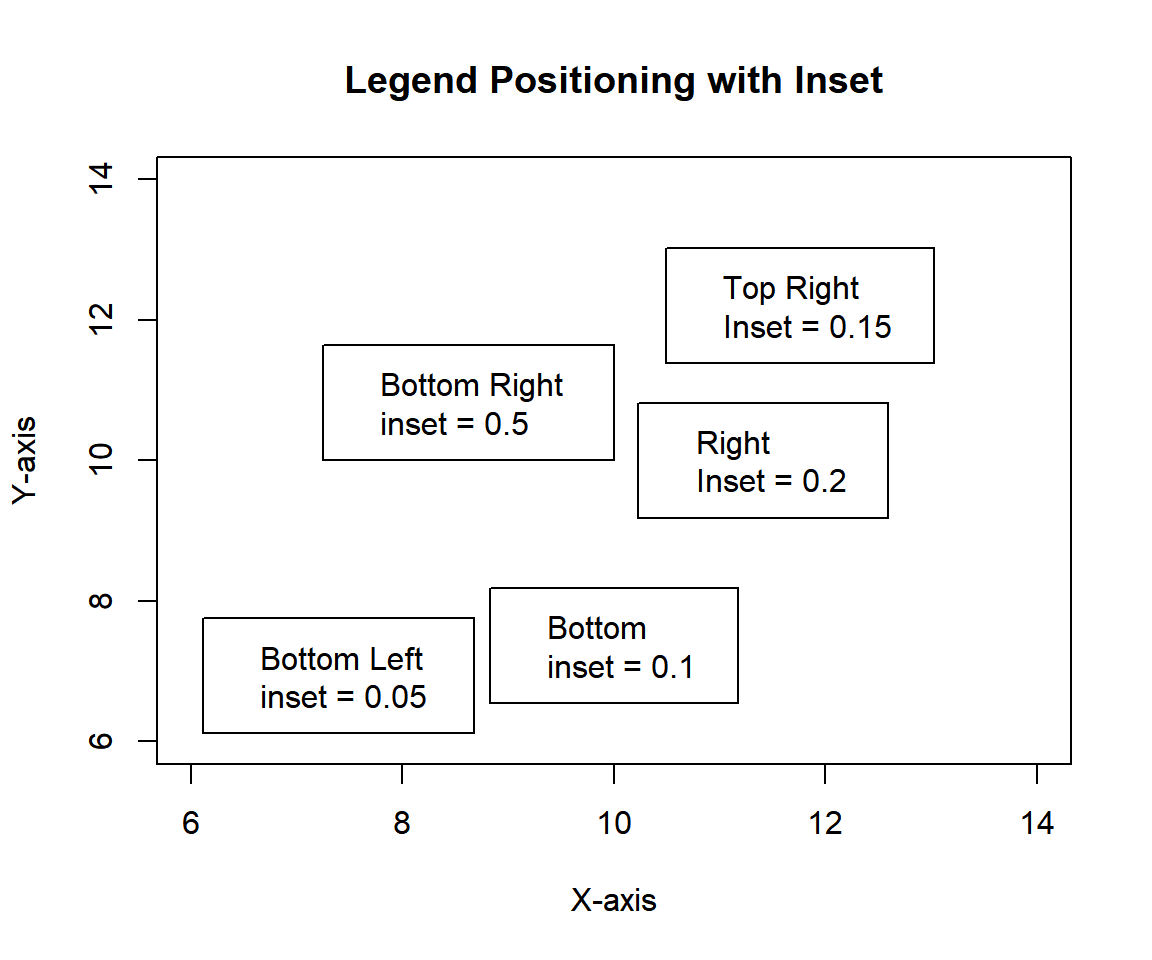
Example of Inset Legends in R
You can also use the X and Y co-ordinates, the location of the co-ordinates will be the top-left point of your legend. See examples below.
plot(c(0, 10), c(0,10), type="n")
legend(0, 9.5, c("Position", "x = 0, y = 9.5"))

plot(c(0, 10), c(0,10), type="n")
legend(7, 10, c("Position", "x = 7, y = 10"))

plot(c(0, 10), c(0,10), type="n")
legend(7, 2, c("Position", "x = 7, y = 2"))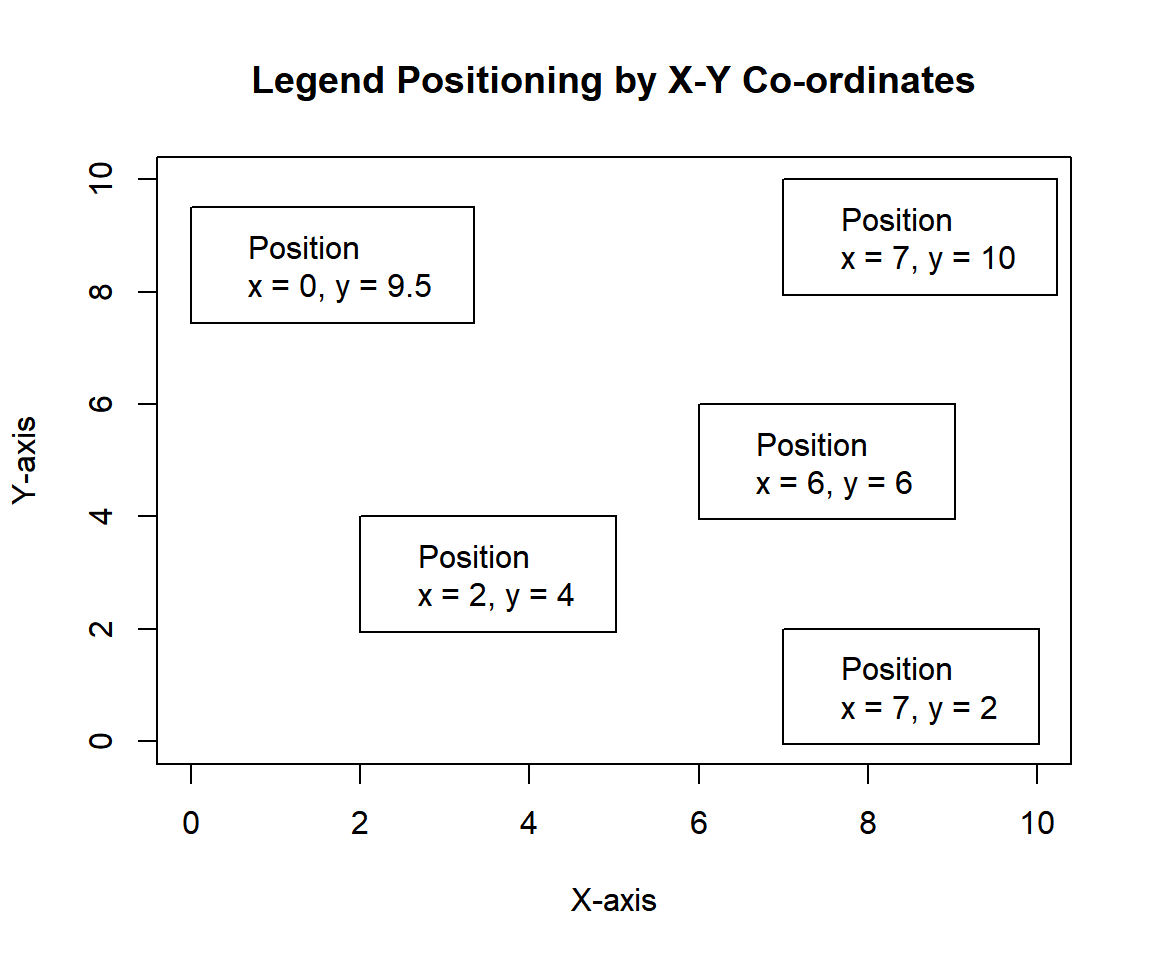
Example of Legend Position by X and Y Co-ordinates in R
2 Simple Legend in R
Here is an example of a simple legend using fill.
See also box plots.
set.seed(123)
Boxdata = rnorm(20)
Boxgroup = c(rep("A", 10), rep("B", 10))
boxplot(Boxdata ~ Boxgroup,
        col = c("limegreen", "pink"),
        main = "Box Plot with Filled Legend")

# Legend Codes

legend("bottom", inset = 0.1,
       c("A Box", "B Box"),
       fill = c("limegreen", "pink"))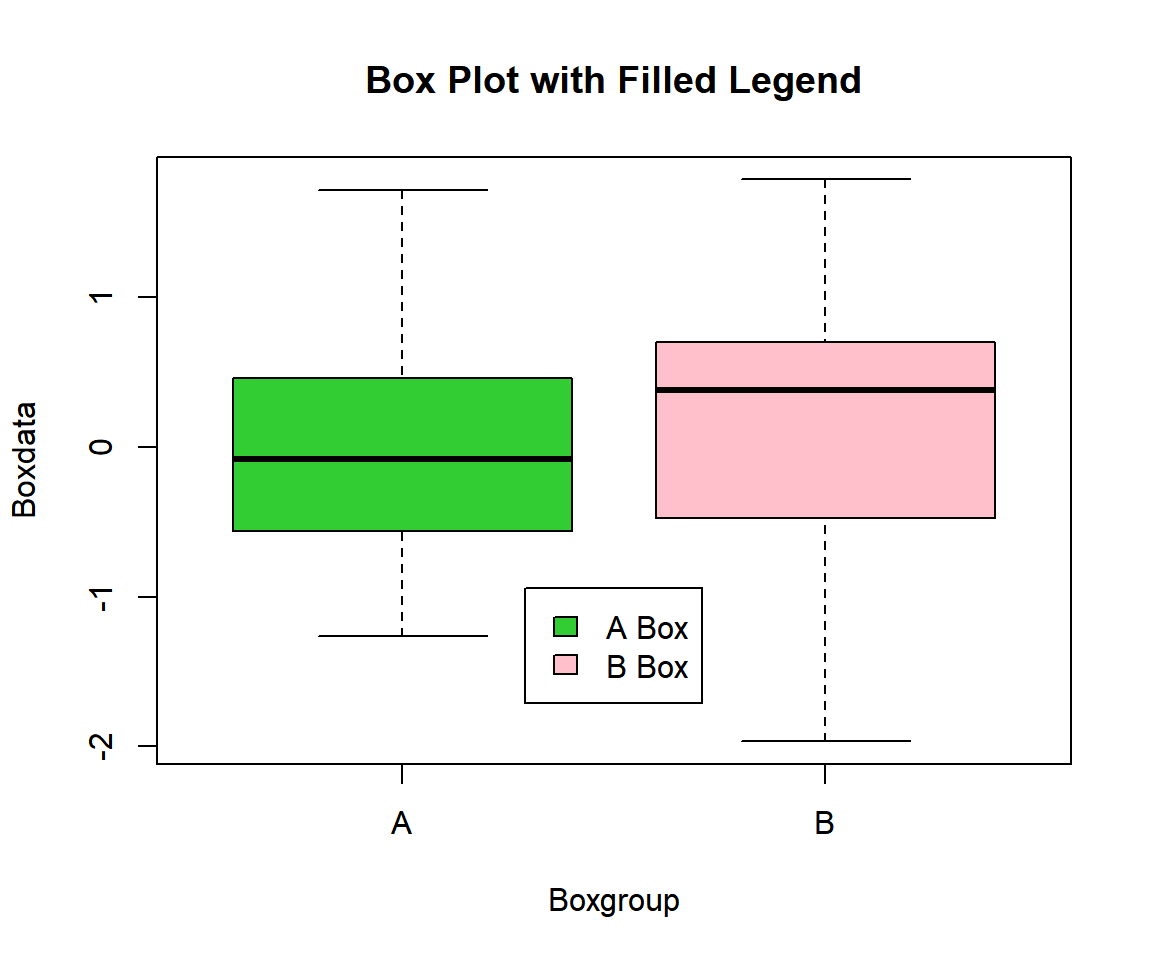
Simple Legend in R
3 Horizontal Legend in R
Here is an example of a horizontal legend. This is done by setting
the "horiz" argument equal to TRUE.
set.seed(12)
Boxdata = rexp(40)
Boxgroup = rep(c("A", "B"), each = 20)
boxplot(Boxdata ~ Boxgroup,
        col = c("orange", "skyblue"),
        main = "Box Plot with Horizontal Legend")

# Legend Codes

legend("topright", inset = 0.05,
       c("A Box", "B Box"),
       fill = c("orange", "skyblue"),
       horiz = TRUE)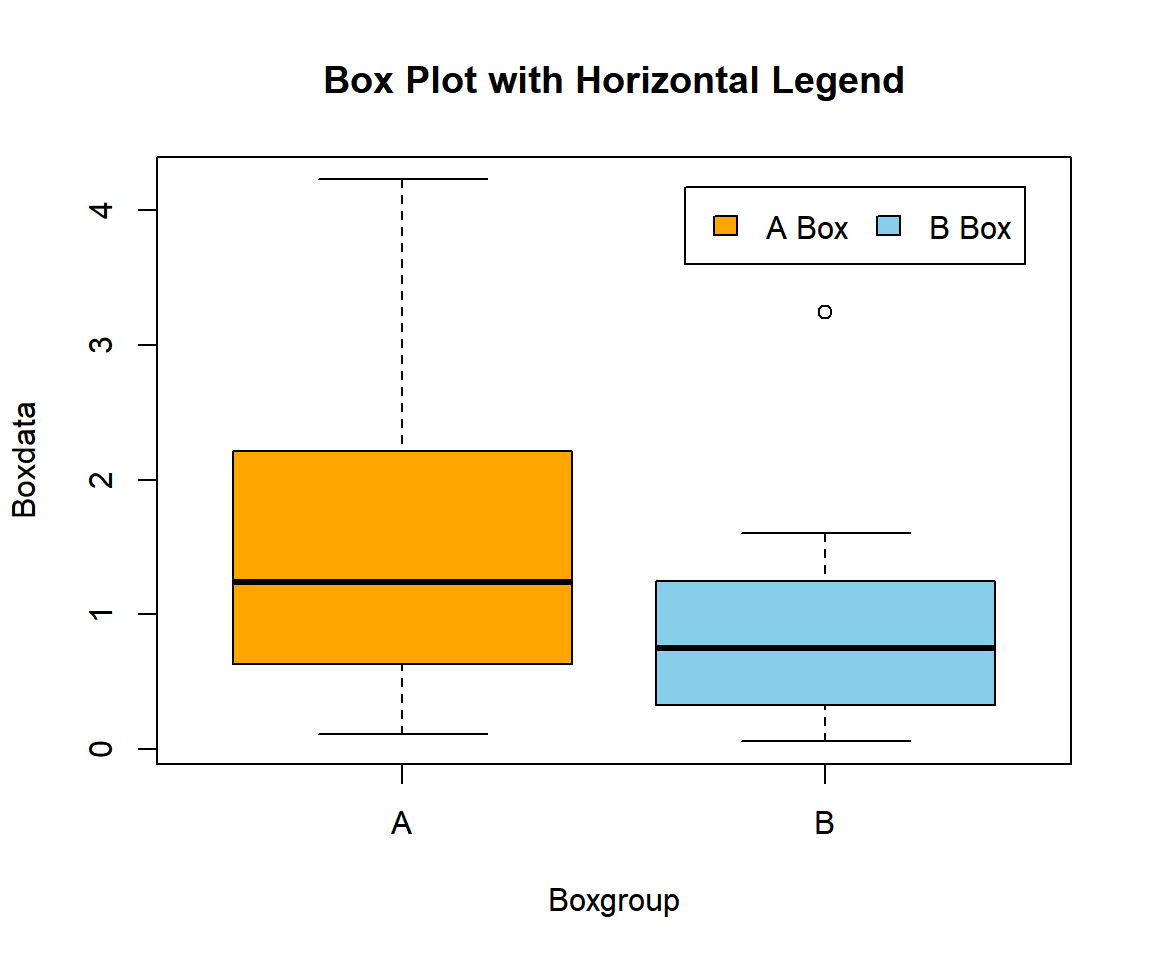
Horizontal Legend in R
4 Legend with Text Color, Title & Title Color, Font Sizes and Background Color in R
Here is an example of a legend with text color (col), title (title) & title color (title.col), font sizes (cex), and background color (bg) all set.
See also scatter plots, colors and point types and sizes.
set.seed(20)
xdata1 = rnorm(10); ydata1 = xdata1 + rnorm(10)/4
xdata2 = rnorm(10); ydata2 = xdata2 + rnorm(10)/4
xdata3 = rnorm(10); ydata3 = xdata3 + rnorm(10)/4
plot(xdata1, ydata1, pch = 0, col = "red",
     xlab = "X-axis", ylab = "Y-axis",
     main = "Scatter Plot with Colored Text, Title, Fonts and Background")
points(xdata2, ydata2, pch = 1, col = "black")
points(xdata3, ydata3, pch = 2, col = "green")

# Legend Codes

legend(0, -1,
       c("Xdata1: Red Sq.", "Xdata2: Black Cir.", "Xdata3: Green Tri."),
       text.col = c("red", "black", "green"),
       title = "Named Legend",
       title.col = "blue",
       cex = 0.8,
       pch = c(0, 1, 2),
       col = c("red", "black", "green"),
       bg = "yellow",
       pt.cex = 1.5,
       text.font = 4)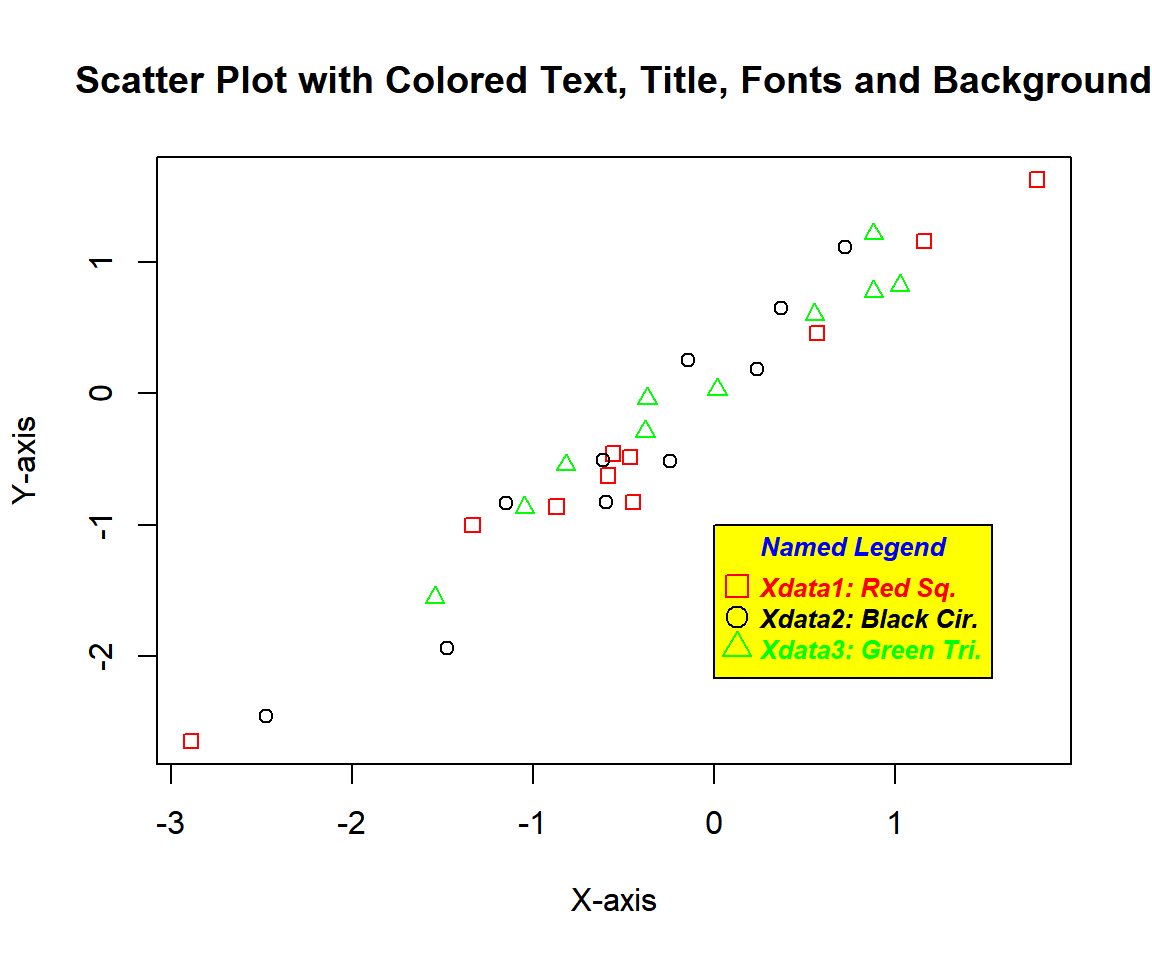
Legend with Text Color, Title & Title Color, Font Sizes, and Background Color in R
5 Legend with 2 or More Columns in R
Here is an example of a legend with 2 or more columns. This is done by setting the "ncol" argument.
set.seed(12)
xdata1 = rexp(10); ydata1 = xdata1 + rnorm(10)/4
xdata2 = rexp(10); ydata2 = xdata2 + rnorm(10)/4
xdata3 = rexp(10); ydata3 = xdata3 + rnorm(10)/4
plot(xdata1, ydata1, pch = 0, col = "red",
     xlab = "X-axis", ylab = "Y-axis",
     main = "Scatter Plot with 2 Columns Legend")
points(xdata2, ydata2, pch = 1, col = "black")
points(xdata3, ydata3, pch = 2, col = "green")

# Legend Codes

legend(0, 4,
       c("Red Square", "Black Circle", "Green Triangle"),
       text.col = c("red", "black", "green"),
       pch = c(0, 1, 2),
       col = c("red", "black", "green"),
       ncol = 2)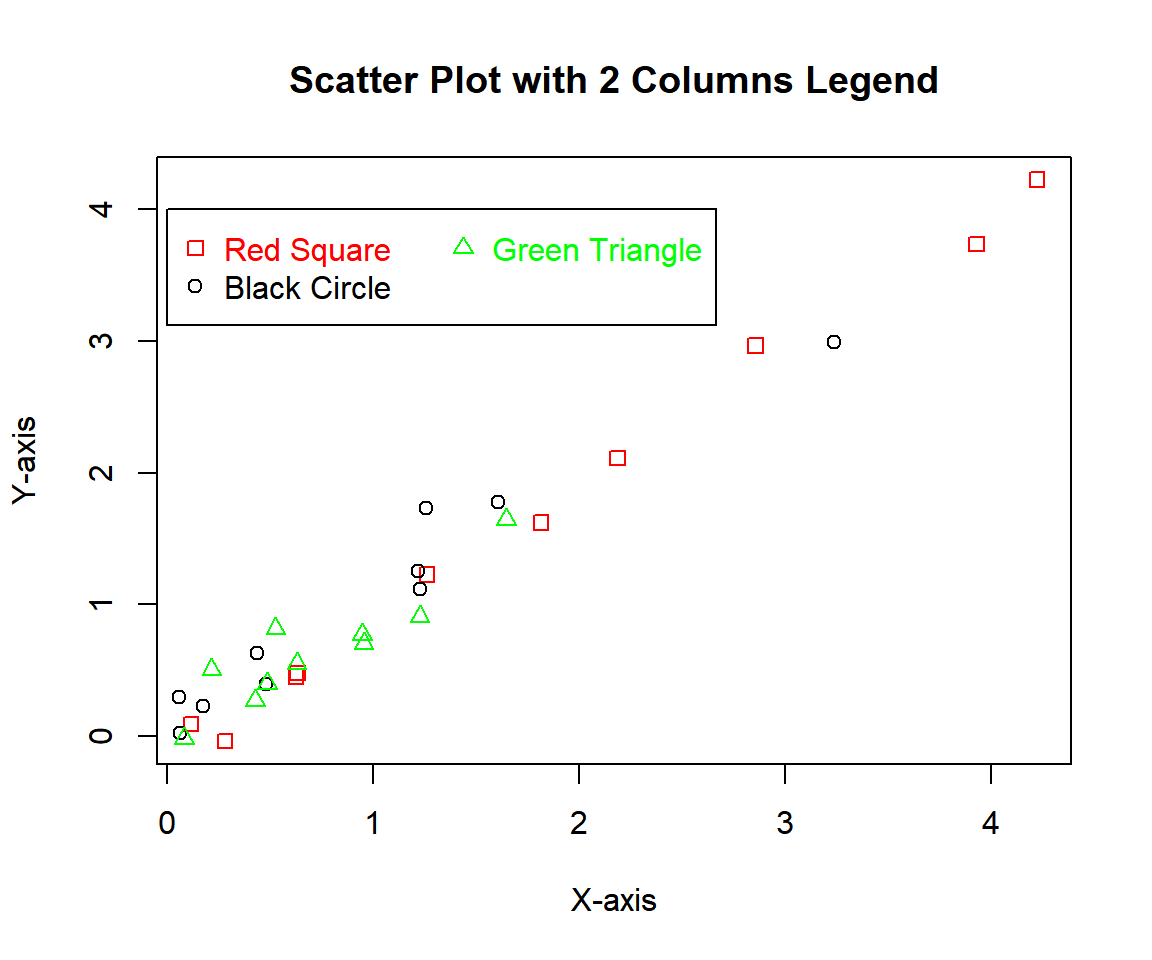
Legend with 2 or More Columns in R
6 Legend with Lines and Points in R
Here is an example of a legend with lines. This is done by setting the "lty" argument for line type.
See also line charts and line types and widths.
set.seed(10)
x1 = rnorm(20); y1 = 1.5*x1 + rnorm(20)/4
x2 = rnorm(20); y2 = 0.75*x2 + rnorm(20)/4
x3 = rnorm(20); y3 = x3 + rnorm(20)/4
plot(1, 1, pch = "",
     xlim = range(c(x1, x2, x3)),
     ylim = range(c(y1, y2, y3)),
     xlab = "X-axis", ylab = "Y-axis",
     main = "Legend with Lines")
abline(lm(y1 ~ x1), col = "red", lty = 1)
abline(lm(y2 ~ x2), col = "black", lty = 2)
abline(lm(y3 ~ x3), col = "green", lty = 3)

# Legend Codes

legend("topleft",
       c("Red Line", "Black Line", "Green Line"),
       text.col = c("red", "black", "green"),
       lty = c(1, 2, 3),
       col = c("red", "black", "green"),
       bty = "n")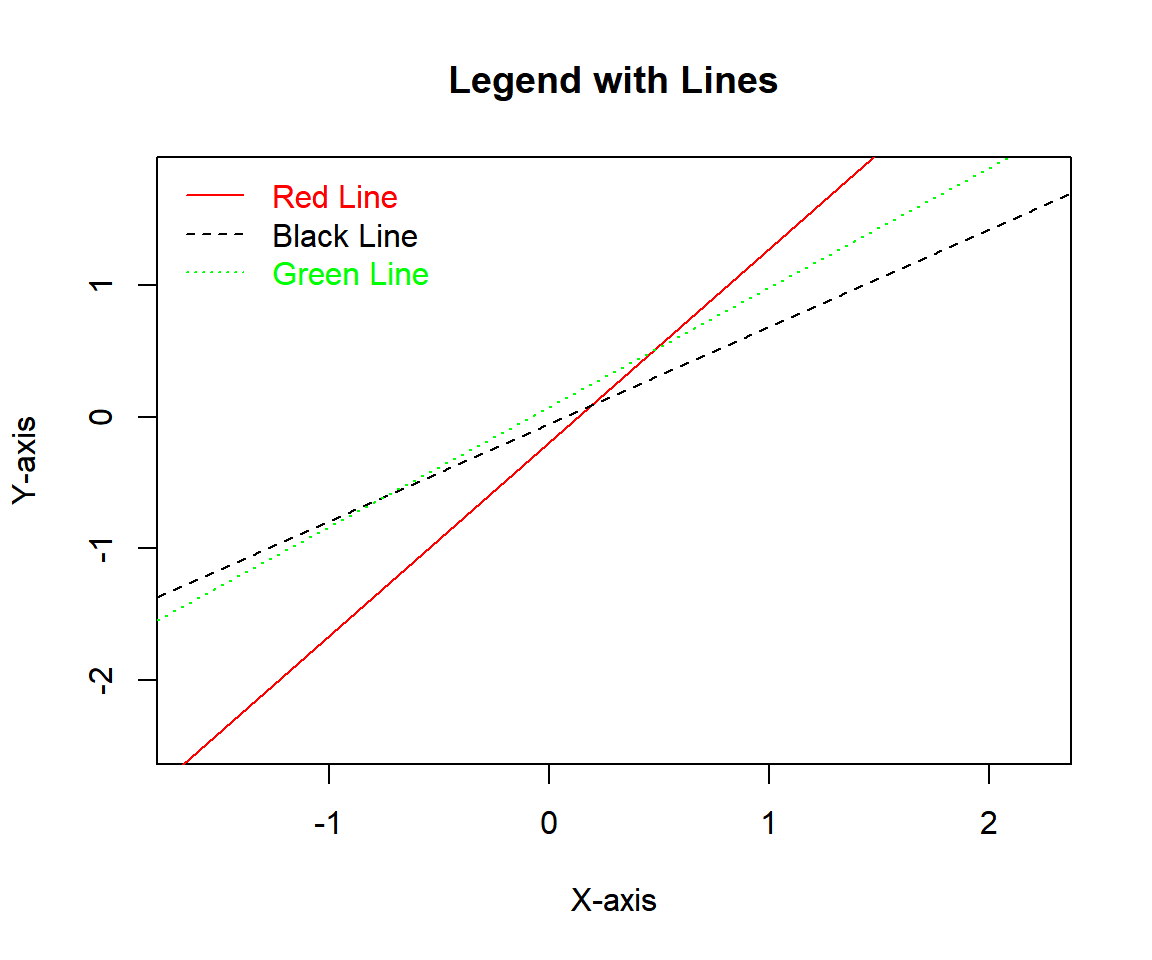
Legend with Lines in R
Here is an example of a legend with lines and points. This is done by setting the "lty" argument for line type, "pch" argument for point type and "merge" argument to merge both line and points.
set.seed(10)
x1 = rnorm(10); y1 = 1.75*x1 + rnorm(10)/5
x2 = rnorm(10); y2 = 0.85*x2 + rnorm(10)/5
x3 = rnorm(10); y3 = 0.4*x3 + rnorm(10)/5
plot(x1, y1, pch = 0, col = "red",
     xlab = "X-axis", ylab = "Y-axis",
     xlim = range(c(x1, x2, x3)),
     ylim = range(c(y1, y2, y3)),
     main = "Legend with Lines and Points")
points(x2, y2, pch = 1, col = "black")
points(x3, y3, pch = 2, col = "green")
abline(lm(y1 ~ x1), col = "red", lty = 1)
abline(lm(y2 ~ x2), col = "black", lty = 2)
abline(lm(y3 ~ x3), col = "green", lty = 3)

# Legend Codes

legend("bottomright", c("Red Solid Line & Square",
               "Black Dashed Line & Circle",
               "Green Dotted Line & Triangle"),
       text.col = c("red", "black", "green"),
       lty = c(1, 2, 3),
       pch = c(0, 1, 2),
       merge = TRUE,
       col = c("red", "black", "green"))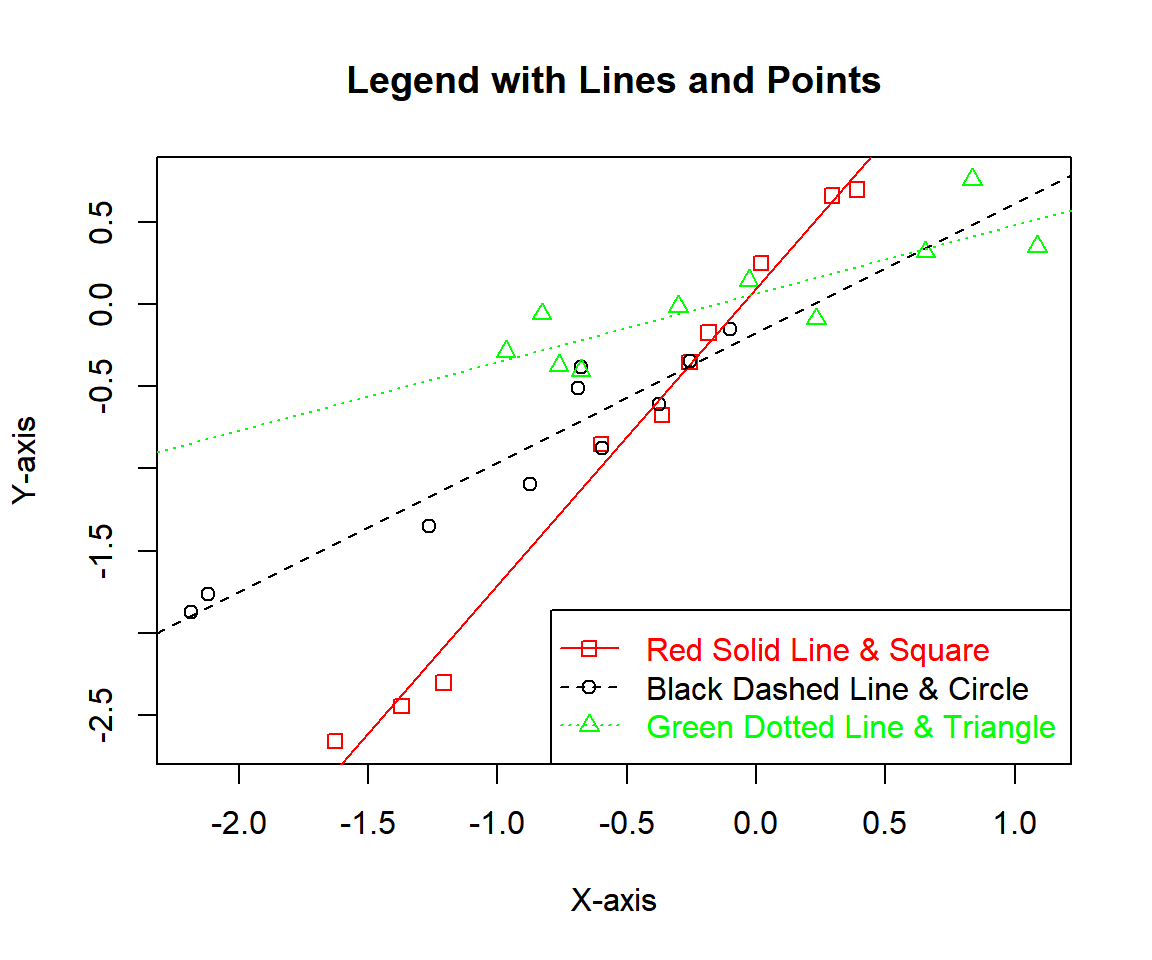
Legend with Lines and Points in R
The feedback form is a Google form but it does not collect any personal information.
Please click on the link below to go to the Google form.
Thank You!
Go to Feedback Form
Copyright © 2020 - 2026. All Rights Reserved by Stats Codes