Colors in R
Here, we discuss colors in R, all the named colors in R, colors based
on rgb(), gray() and color palettes like the
rainbow() function.
All functions are from the "grDevices" package.
You can set color in graphs and plots with the argument col, for example:
See also setting colors & fonts and plots & charts to see how colors are used on different plots and charts.
1 List of All the Colors in R
There are 657 named colors in R. They can be viewed with the entry below in your console:
Or select specific numbers in the figure below to view specific color names:
[1] "white"[1] "honeydew4"[1] "tomato2"The figure below shows all the colors from Color 1 to Color 657.
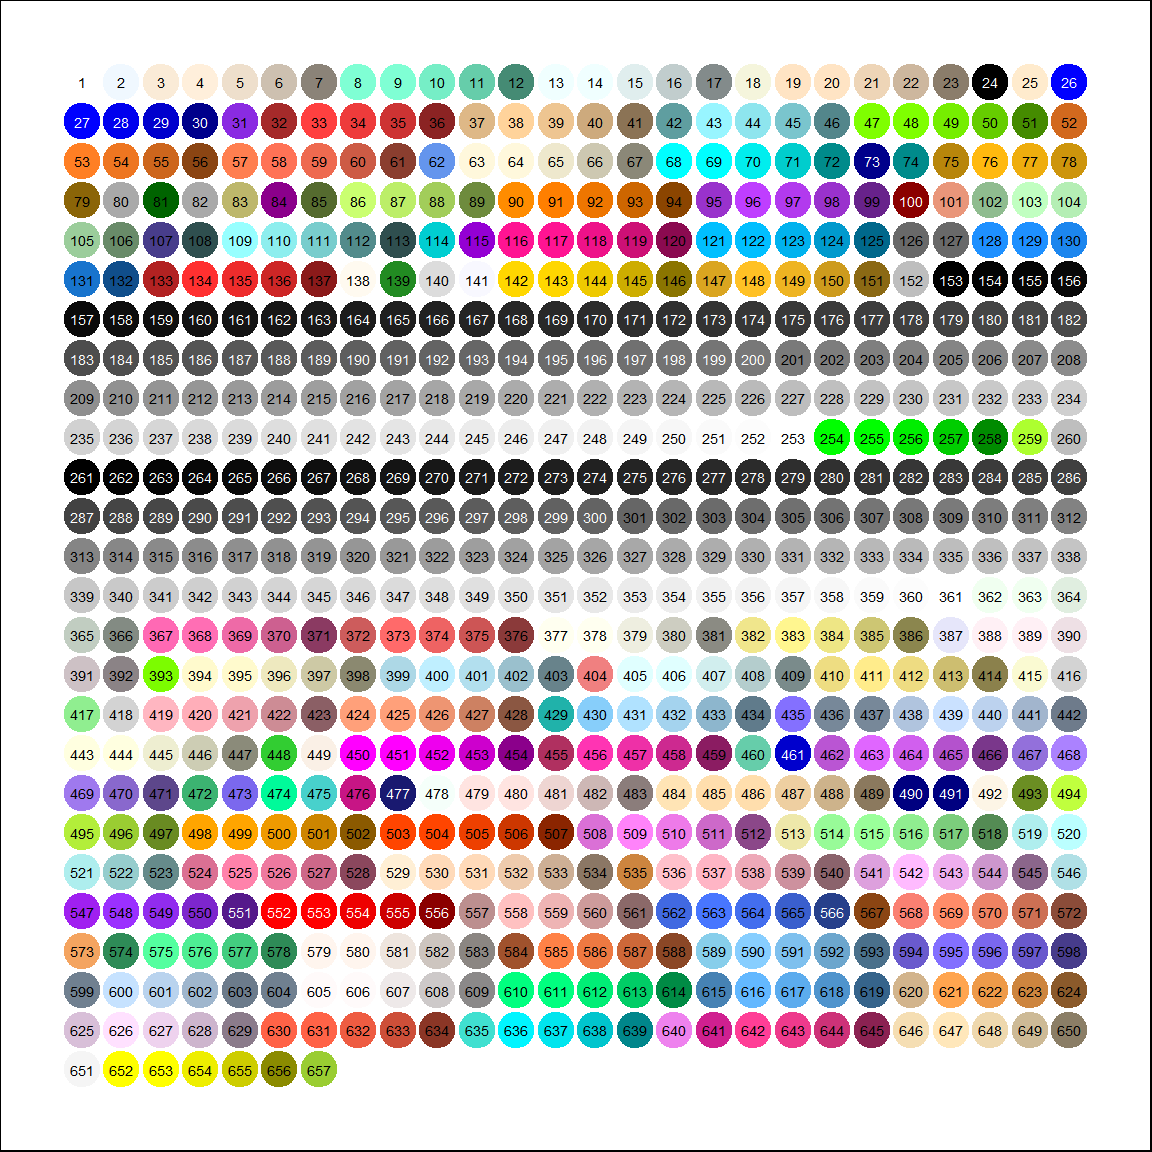
Figure Showing All the Colors in R
Also, the paginated table below lists all the colors from Color 1 to Color 657. You can filter the table by color name or color number range.
2 Rainbow Colors in R
For easy expression of colors in R, you can use one of the many color pallets available which includes the rainbow palette.
To derive 4 or 8 colors for example, you simply use the
rainbow() function with argument 4 or 8 respectively.
Hence, instead of listing 3 colors as in
col = c("tan", "orange", "violet"), use
rainbow(3) if you are fine with any 3 different colors.
[1] "#FF0000" "#80FF00" "#00FFFF" "#8000FF"[1] "#FF0000" "#FFBF00" "#80FF00" "#00FF40" "#00FFFF" "#0040FF" "#8000FF"
[8] "#FF00BF"[1] "#FF0000" "#FFBF00" "#80FF00" "#00FF40"[1] "#00FFFF" "#0040FF" "#8000FF" "#FF00BF"The appearance of these colors can be seen in the figure below.
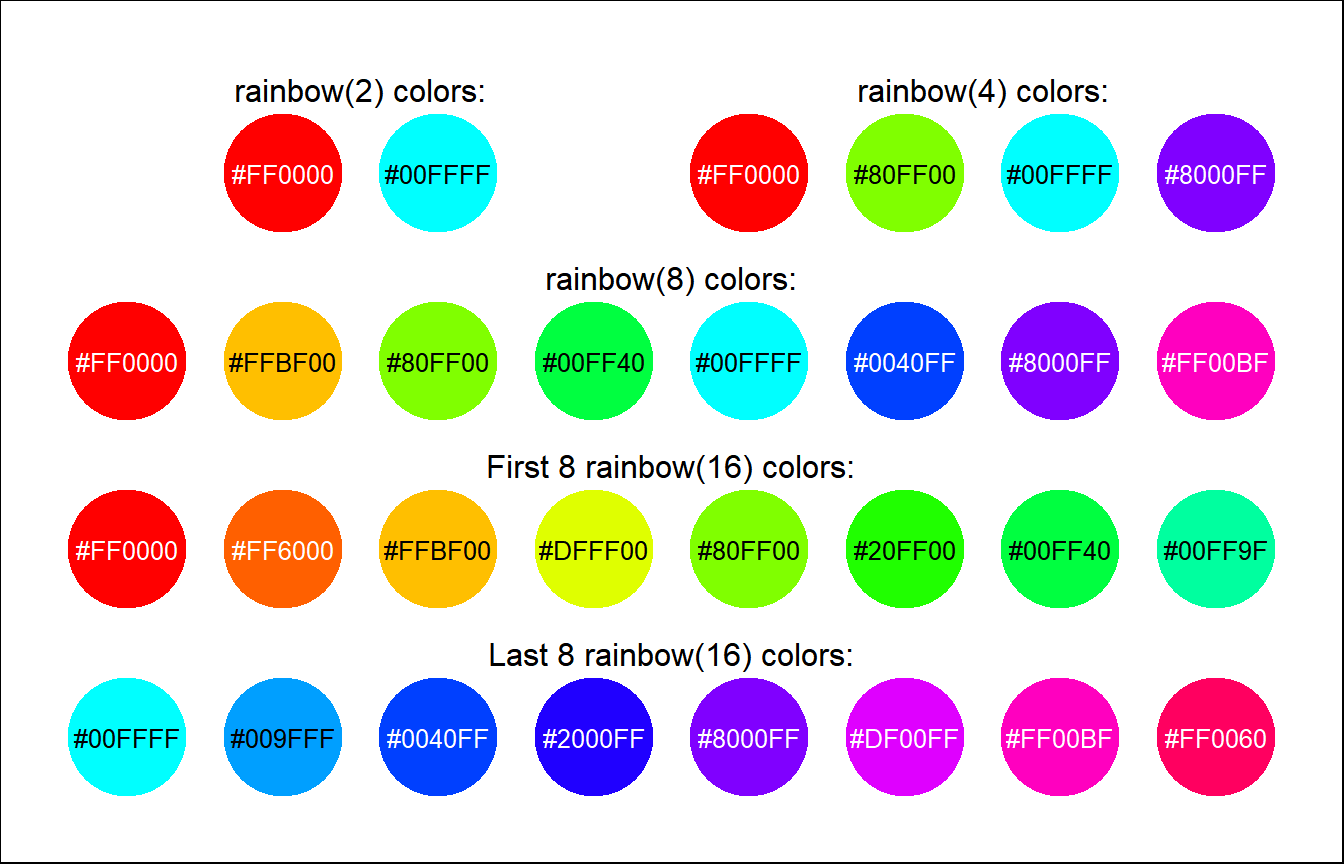
Colors from the Rainbow Palette in R
3 Gray Colors in R
For gray scale colors, you can use the gray() function.
It takes values between 0 and 1, with 0 meaning "black" and 1 meaning
"white".
To derive 4 colors for example, you simply use
gray((1:4)/4) or
gray(c(1/4, 2/4, 3/4, 4/4)).
[1] "#404040" "#808080" "#BFBFBF" "#FFFFFF"[1] "#404040" "#808080" "#BFBFBF" "#FFFFFF"The appearance of these colors can be seen in the figure below.
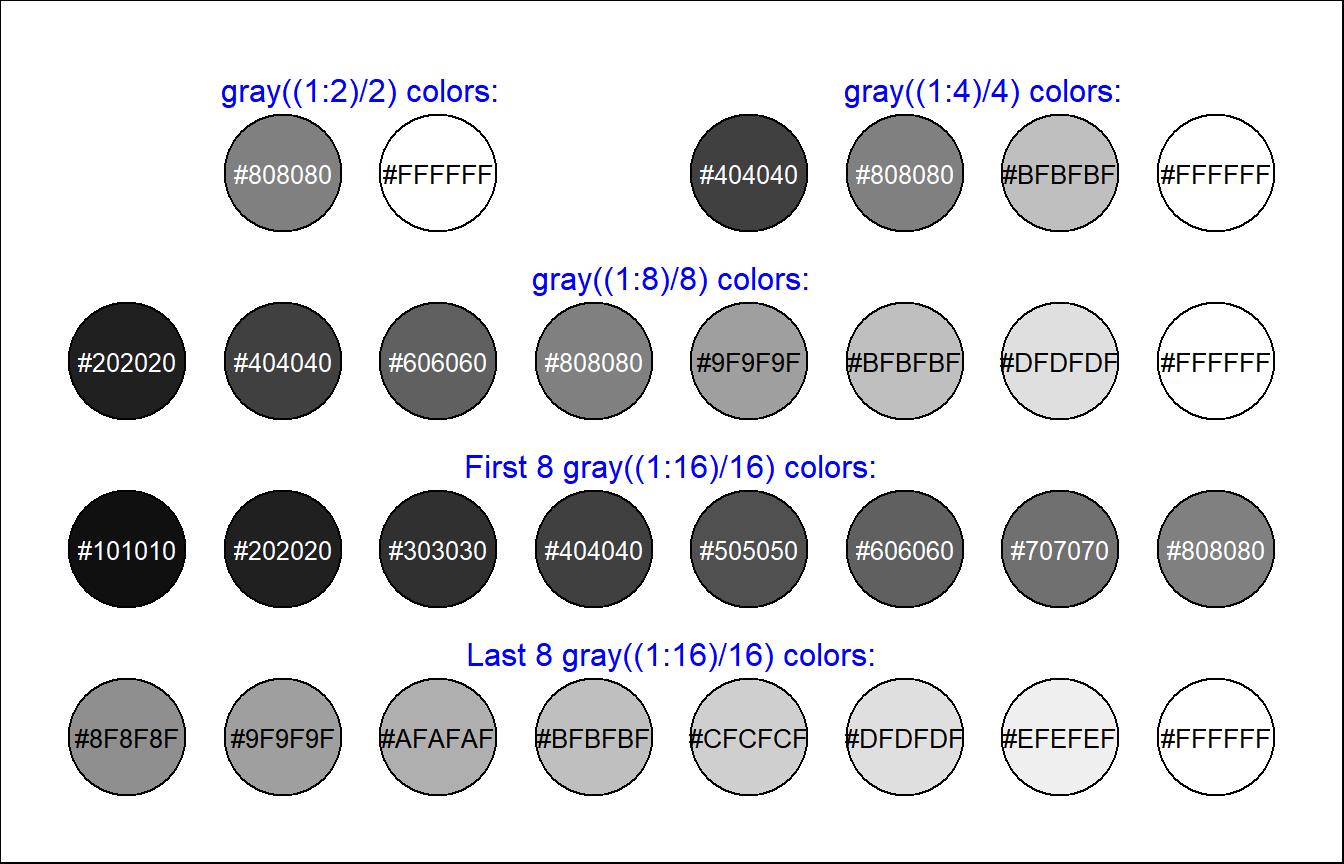
Gray Scale Colors in R
4 RGB Colors in R
For the RGB color specification, you can use the rgb()
function. It takes values between 0 and 1, for each of "red", "green",
and "blue" respectively.
To derive a color for example, you simply use
rgb(0.5, 1, 0). rgb(1, 0, 0) = "red",
rgb(0, 1, 0) = "green", rgb(0, 0, 1) =
"blue".
[1] "#80FF00"The appearance of examples from color specifications of this format can be seen in the figure below.
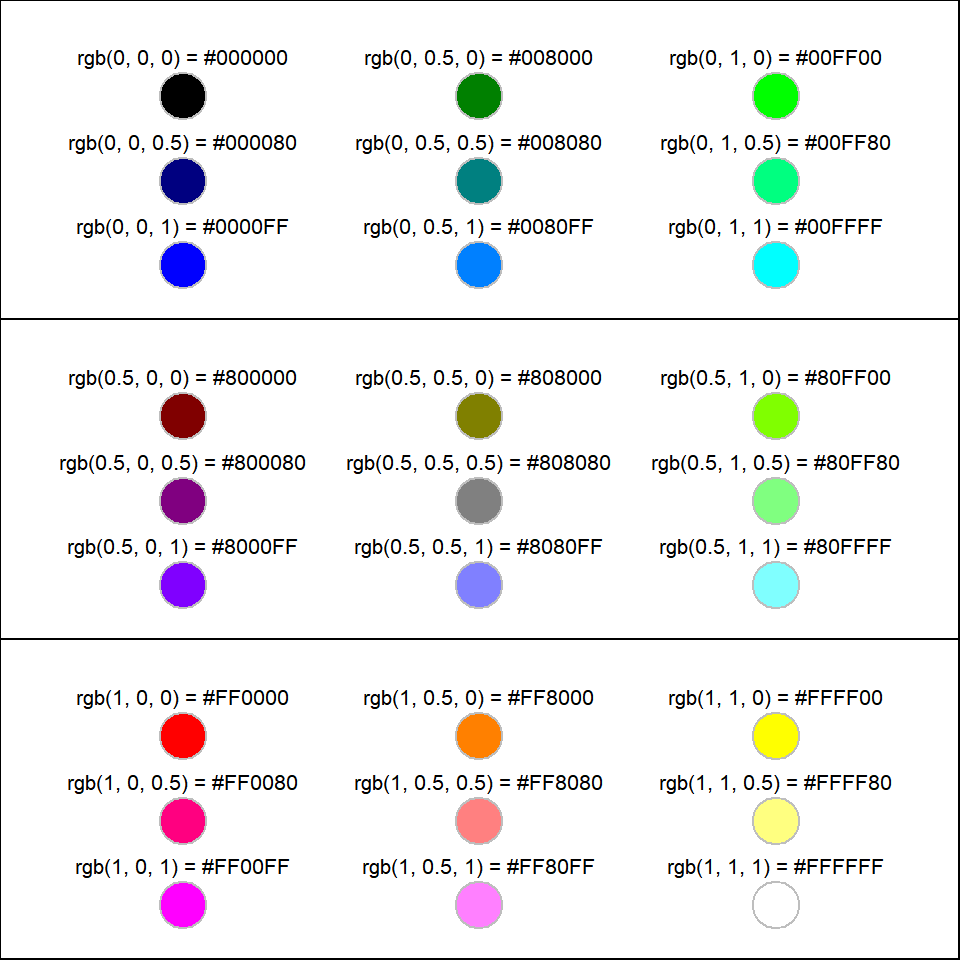
RGB Format Colors in R
5 Color Palettes in R
Here we present color palettes in R which includes,
rainbow(), cm.colors(),
hcl.colors(), heat.colors(),
terrain.colors() and topo.colors().
These are done in pie chart formats.
The figures below show what 3, 8, and 12 colors (for example
rainbow(3)) from these palettes look like in R.
[1] "#FF0000" "#00FF00" "#0000FF"3 colors:
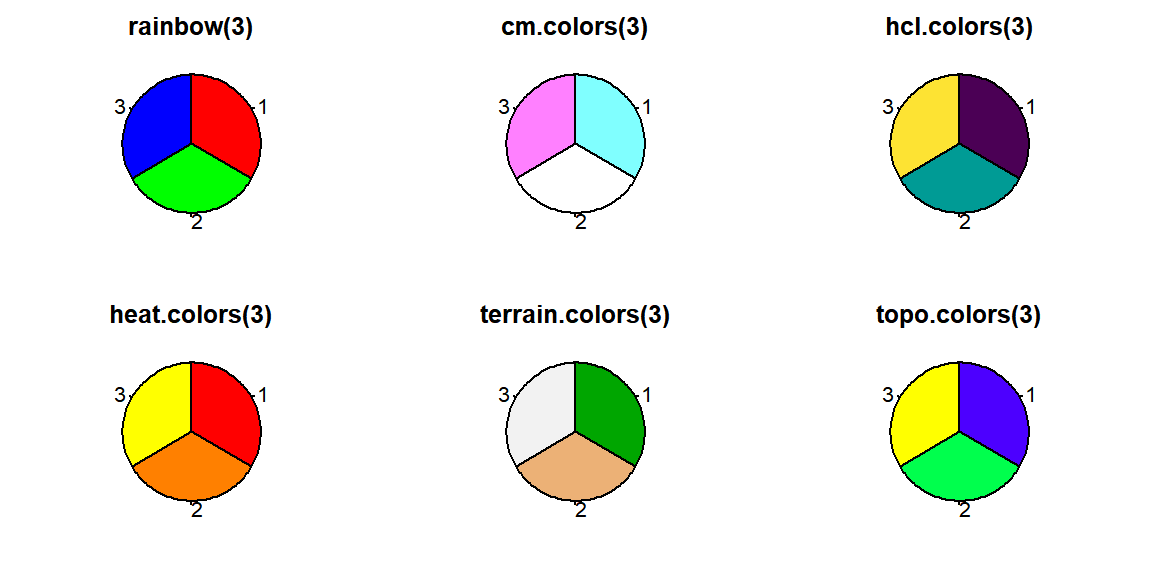
3 Colors from Color Palettes in R
8 colors:
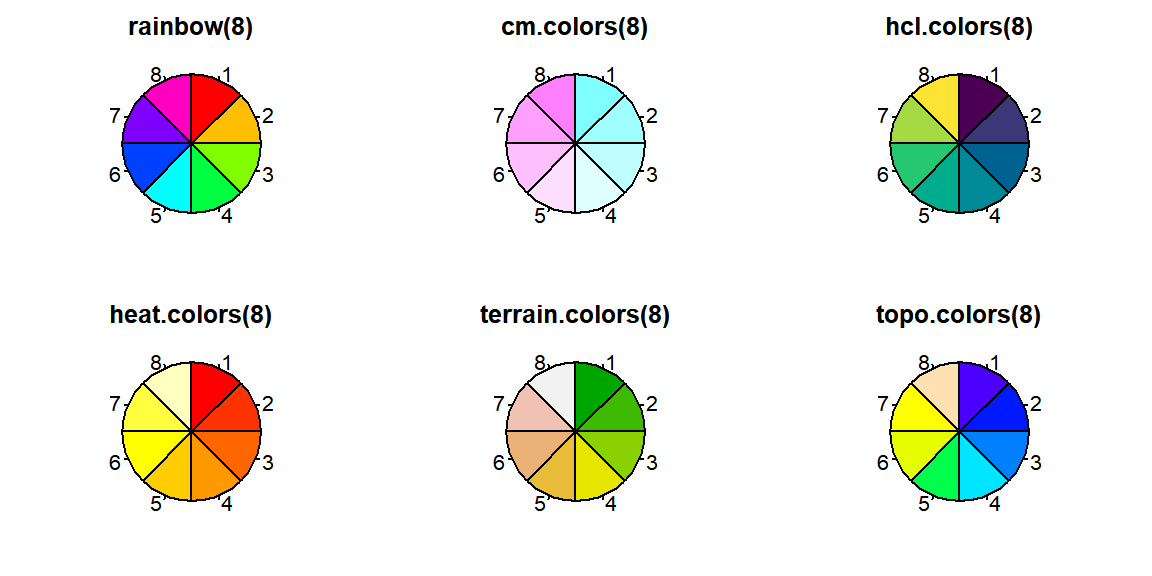
8 Colors from Color Palettes in R
12 colors:
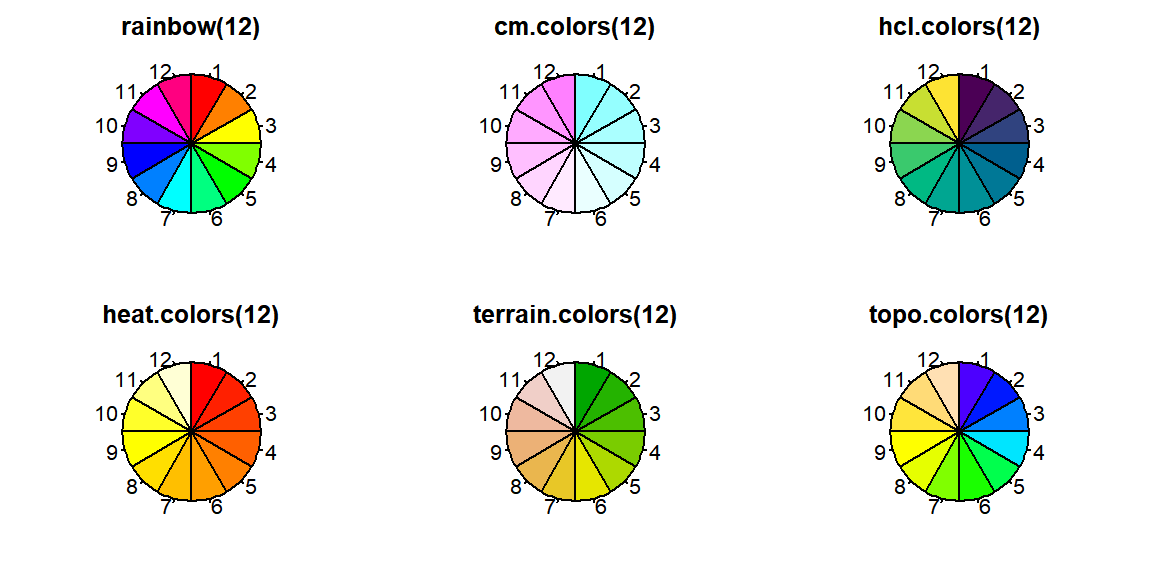
12 Colors from Color Palettes in R
Transparency of Color Palettes in R:
The palettes, rgb() and gray() all have
transparency option which is specified with the "alpha" argument. For
example rainbow(12, alpha = 0).
 [1] "#FF000000" "#FF800000" "#FFFF0000" "#80FF0000" "#00FF0000" "#00FF8000"
 [7] "#00FFFF00" "#0080FF00" "#0000FF00" "#8000FF00" "#FF00FF00" "#FF008000"
It takes values between 0 and 1. Here, 0 means fully transparent and 1 means opaque, with the default value equal to 1.
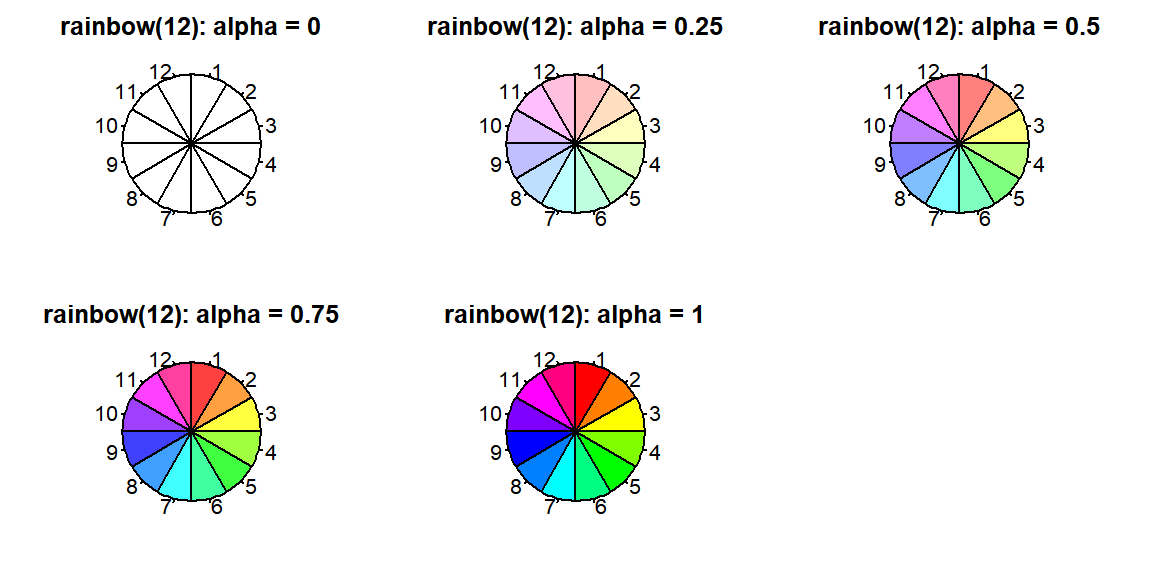
Transparency of Colors Palettes in R
The feedback form is a Google form but it does not collect any personal information.
Please click on the link below to go to the Google form.
Thank You!
Go to Feedback Form
Copyright © 2020 - 2026. All Rights Reserved by Stats Codes