Hypergeometric Distributions in R
- 1 Table of Hypergeometric Distribution Functions in R
- 2 Plot of Hypergeometric Distributions in R
- 3 Examples for Setting Parameters for Hypergeometric Distributions in R
- 4 rhyper(): Random Sampling from Hypergeometric Distributions in R
- 5 dhyper(): Probability Mass Function for Hypergeometric Distributions in R
- 6 phyper(): Cumulative Distribution Function for Hypergeometric Distributions in R
- 7 qhyper(): Derive Quantile for Hypergeometric Distributions in R
Here, we discuss hypergeometric distribution functions in R, plots, parameter setting, random sampling, mass function, cumulative distribution and quantiles.
The hypergeometric distribution for the number of white balls drawn with parameters, \(m\) (the number of white balls in the urn), \(n\) (the number of black balls in the urn), and \(k\) (the number of draws without replacement from the urn), has probability mass function (pmf) formula as:
\[P(X=x)= \frac{\binom{m}{x}\binom{n}{k-x}}{\binom{m+n}{k}},\] for \(x \in \{0, 1, \ldots\ , k\}\) number of white balls drawn,
where \(m \in \{0, 1, \ldots\}\) is the number of white balls in the urn,
\(n \in \{0, 1, \ldots\}\) is the number of black balls in the urn,
and \(k \in \{0, 1, \ldots, m+n\}\), the number of draws without replacement,
the \(\tt{binomial\; coefficient}\) \(\binom{a}{b}\) equals \(\frac{a!}{b!(a-b)!}\),
and \(a!\), the \(\tt{factorial\; operator}\), equals \(a\times(a-1)\times(a-2)\times\cdots\times 1\).
The pmf is positive when \(\max(0, k-n) \le x \le \min(k,m)\).
For \(p = {m \over (m+n)}\), the mean is \(kp\), and the variance is \(kp(1-p)\frac{(m+n)-k}{(m+n)-1}\).
See also probability distributions and plots and charts.
1 Table of Hypergeometric Distribution Functions in R
The table below shows the functions for hypergeometric distributions in R.
| Function | Usage |
| rhyper(nn, m, n, k) | Simulate a random sample with \(nn\) observations |
| dhyper(x, m, n, k) | Calculate the probability mass at the point \(x\) |
| phyper(q, m, n, k) | Calculate the cumulative distribution at the point \(q\) |
| qhyper(p, m, n, k) | Calculate the quantile value associated with \(p\) |
2 Plot of Hypergeometric Distributions in R
Single distribution:
Below is a plot of the hypergeometric distribution function with \(m=12\) (white), \(n=10\) (black), and \(k=6\) (draws).
x = 0:6; y = dhyper(x, 12, 10, 6)
plot(x, y, type = "h",
     xlim = c(0, 6), ylim = c(0, max(y)),
     main = "Probability Mass Function of
Hypergeometric Distribution (m = 12, n = 10, k = 6)",
     xlab = "x", ylab = "Mass",
     col = "blue")
# Add legend
legend("topright", "m = 12, n = 10, k = 6",
       fill = "blue",
       bty = "n")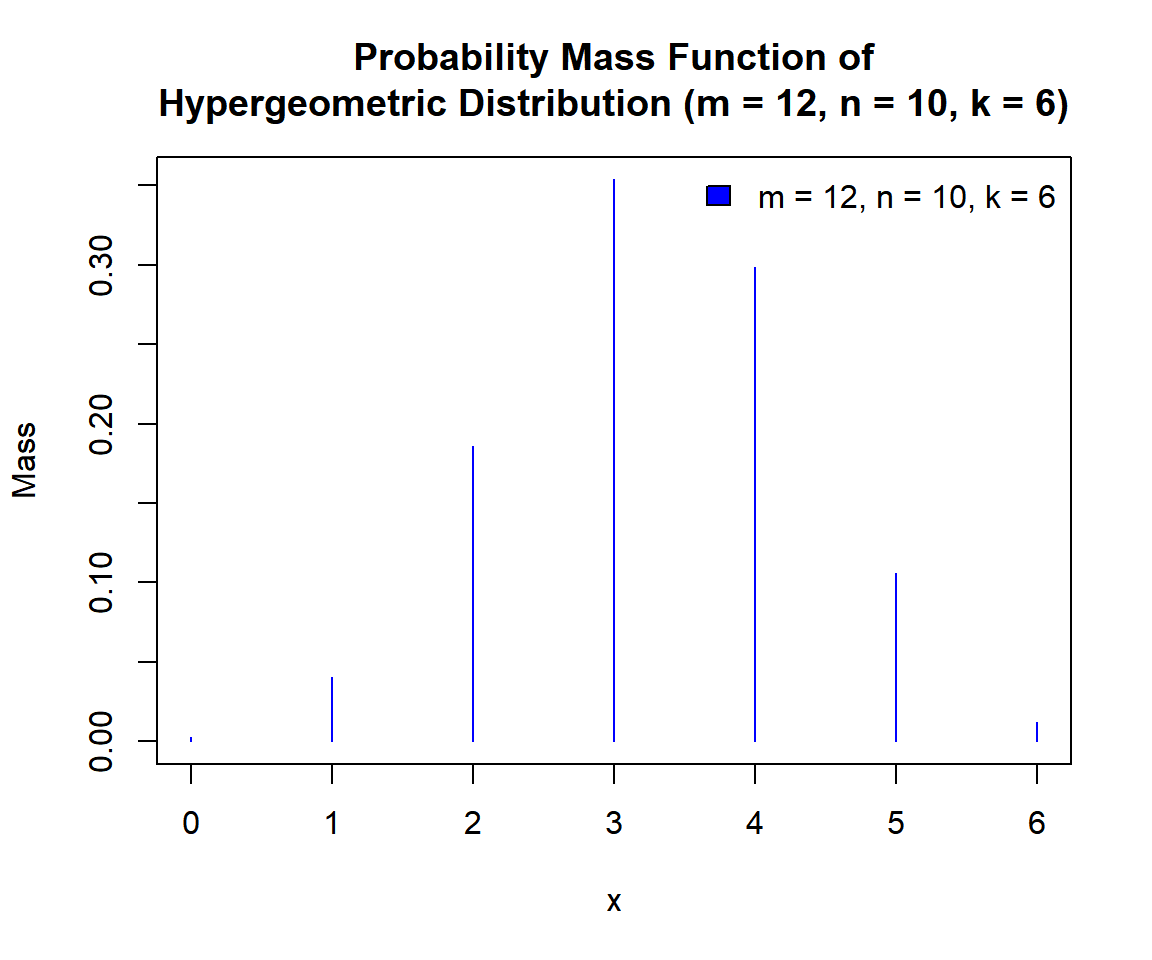
Probability Mass Function (PMF) of a Hypergeometric Distribution in R
Multiple distributions:
Below is a plot of multiple hypergeometric distribution functions in one graph.
x1 = 0:20; y1 = dhyper(x1, 20, 20, 20)
x2 = 0:10; y2 = dhyper(x2, 20, 20, 10)
x3 = 0:10; y3 = dhyper(x3, 10, 20, 10)
plot(x1, y1,
     xlim = c(0, 20), ylim = range(c(y1, y2, y3)),
     main = "Probability Mass Functions of
Hypergeometric Distributions",
     xlab = "x", ylab = "Mass",
     col = "blue")
points(x2, y2, col = "red")
points(x3, y3, col = "green")
# Add legend
legend("topright", c("m = 20, n = 20, k = 20",
                    "m = 20, n = 20, k = 10",
                    "m = 10, n = 20, k = 10"),
       fill = c("blue", "red", "green"),
       bty = "n")
# Add lines
for(i in 1:20){
  segments(x1[i], dhyper(x1[i], 20, 20, 20),
           x1[i+1], dhyper(x1[i+1], 20, 20, 20),
           col = "blue")}
for(i in 1:10){
  segments(x2[i], dhyper(x2[i], 20, 20, 10),
           x2[i+1], dhyper(x2[i+1], 20, 20, 10),
           col = "red")}
for(i in 1:10){
  segments(x3[i], dhyper(x3[i], 10, 20, 10),
           x3[i+1], dhyper(x3[i+1], 10, 20, 10),
           col = "green")}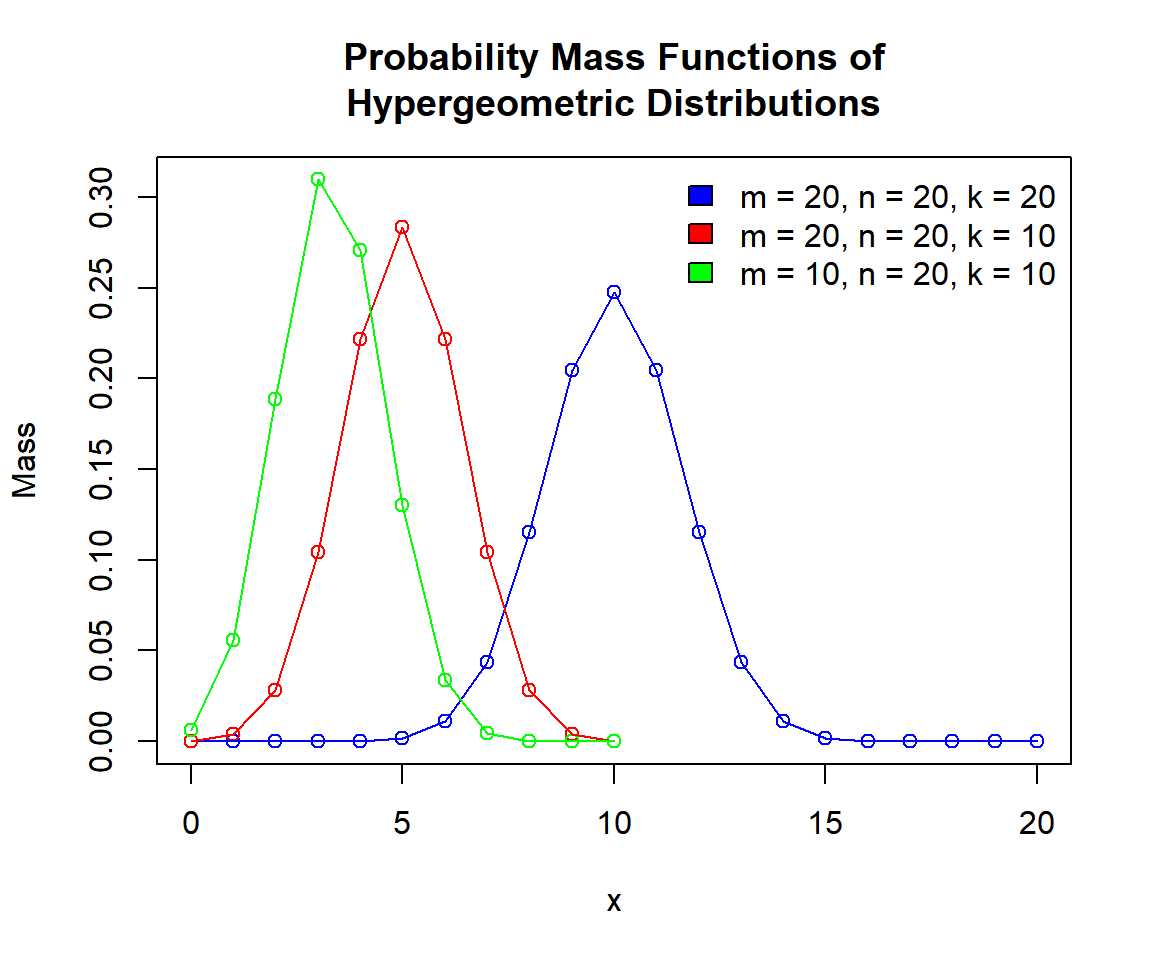
Probability Mass Functions (PMFs) of Hypergeometric Distributions in R
3 Examples for Setting Parameters for Hypergeometric Distributions in R
To set the parameters for the hypergeometric distribution function, with \(m=8\) (white), \(n=6\) (black), and \(k=5\) (draws).
For example, for dhyper(), the following are the
same:
# The order of 8, 6 and 5 matters here as the parameter names are not used.
# The first number 8 is m, 6 is n, and 5 is k.
dhyper(3, 8, 6, 5)
[1] 0.4195804[1] 0.41958044 rhyper(): Random Sampling from Hypergeometric Distributions in R
Sample 1000 observations from the hypergeometric distribution with \(m=50\) (white), \(n=40\) (black), and \(k=25\) (draws):
set.seed(123) # Line allows replication (use any number).
sample = rhyper(1000, 50, 40, 25)
hist(sample,
     main = "Histogram of 1000 Observations from
Hypergeometric Distribution with (m = 50, n = 40, k = 25)",
     xlab = "x",
     col = "lightblue", border = "white")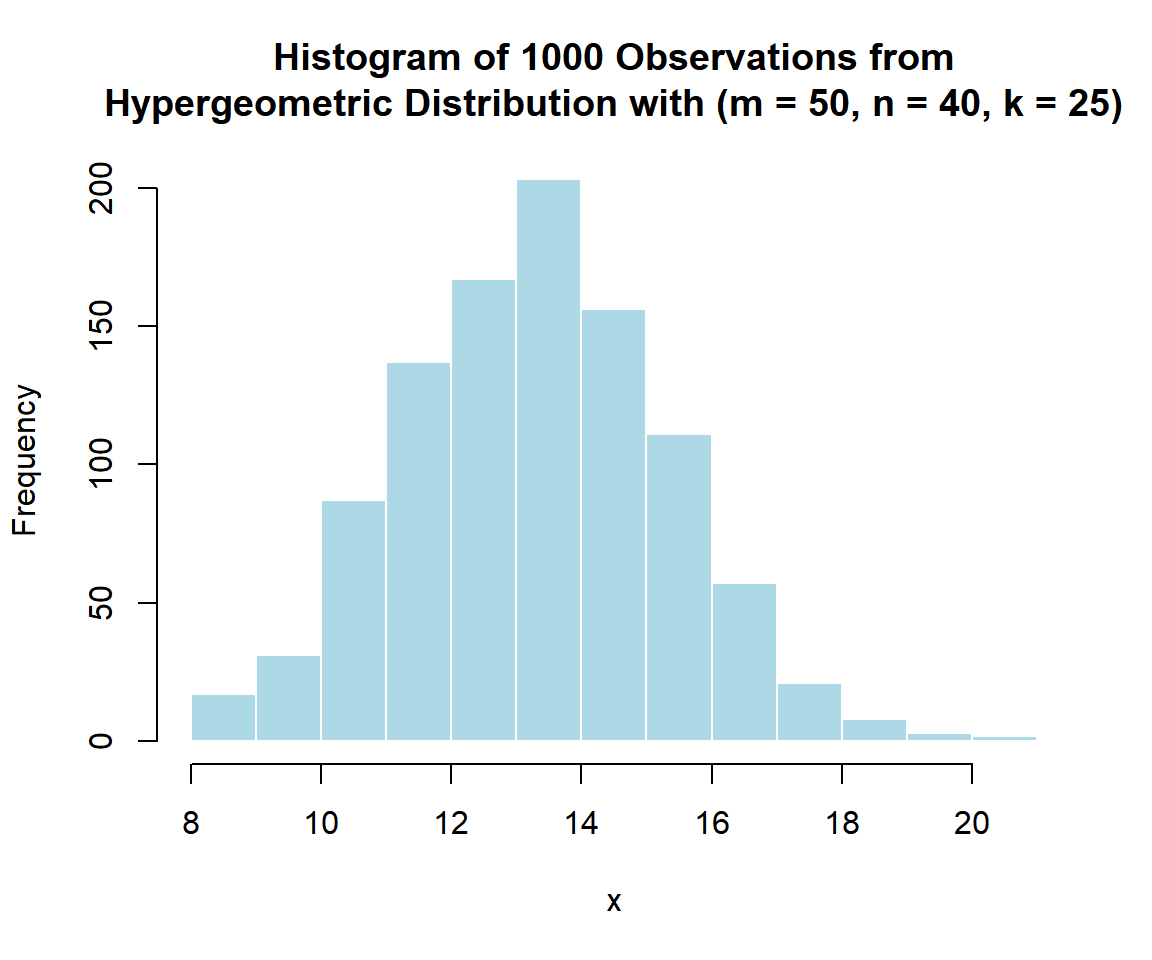
Histogram of Hypergeometric Distribution (m = 50, n = 40, k = 25) Random Sample in R
5 dhyper(): Probability Mass Function for Hypergeometric Distributions in R
Calculate the mass at \(x = 14\), in the hypergeometric distribution with \(m=40\) (white), \(n=60\) (black), and \(k=30\) (draws):
[1] 0.1182048x = 0:30; y = dhyper(x, 40, 60, 30)
plot(x, y,
xlim = c(0, 30), ylim = c(0, max(y)),
main = "Probability Mass Function of
Hypergeometric Distribution with (m = 40, n = 60, k = 30)",
xlab = "x", ylab = "Mass",
col = "blue")
# Add lines
segments(14, -1, 14, 0.1182048)
segments(-1, 0.1182048, 14, 0.1182048)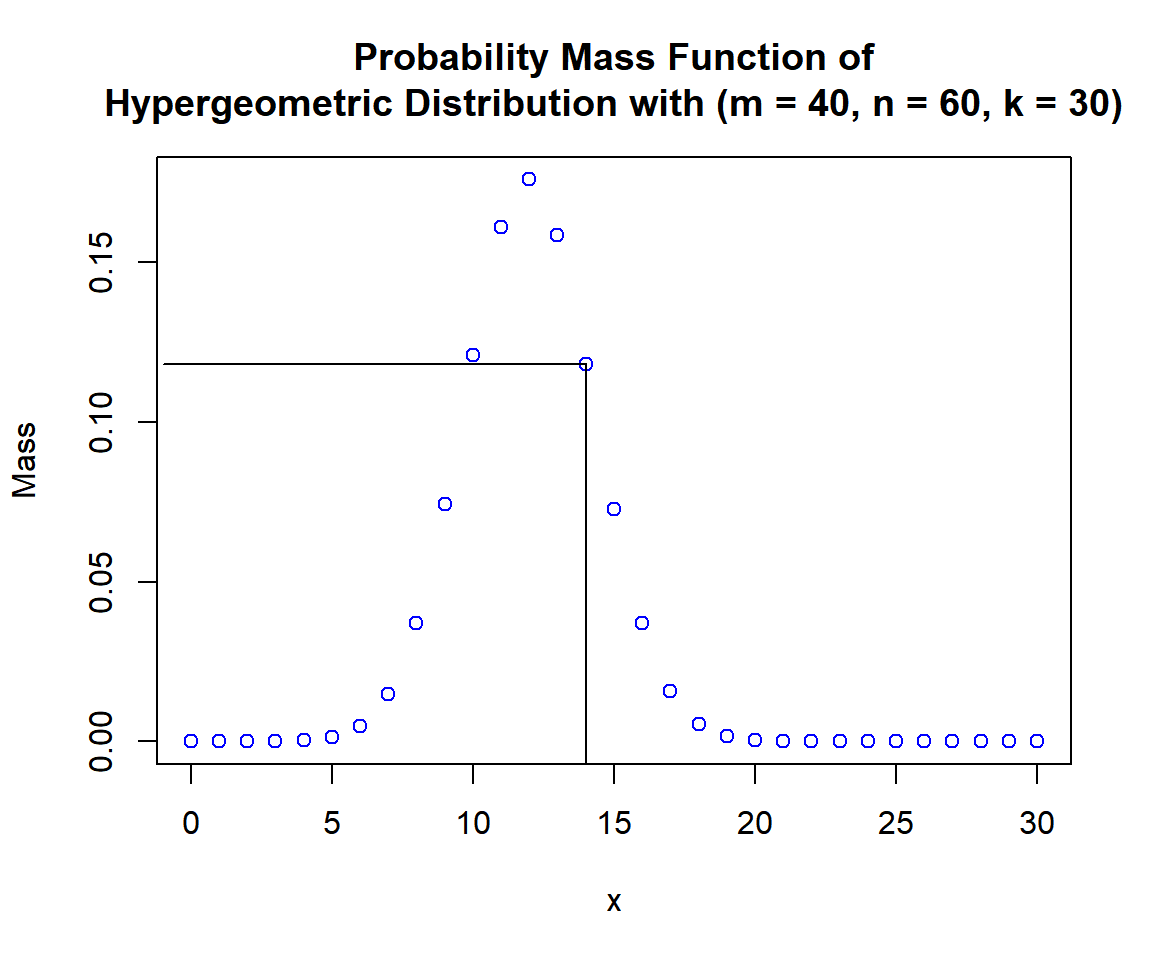
Probability Mass Function (PMF) of Hypergeometric Distribution (m = 40, n = 60, k = 30) in R
6 phyper(): Cumulative Distribution Function for Hypergeometric Distributions in R
Calculate the cumulative distribution at \(x = 9\), in the hypergeometric distribution with \(m=12\) (white), \(n=8\) (black), and \(k=15\) (draws). That is, \(P(X \le 9)\):
[1] 0.7038184x = 0:15; y = phyper(x, 12, 8, 15)
plot(x, y,
xlim = c(0, 15), ylim = c(0, 1),
main = "Cumulative Distribution Function of
Hypergeometric Distribution with (m = 12, n = 8, k = 15)",
xlab = "x", ylab = "Cumulative Distribution",
col = "blue")
# Add lines
for(i in 1:15){
segments(x[i], phyper(x[i], 12, 8, 15),
x[i] + 1, phyper(x[i], 12, 8, 15),
col = "blue")
}
segments(9, -1, 9, 0.7038184)
segments(-1, 0.7038184, 9, 0.7038184)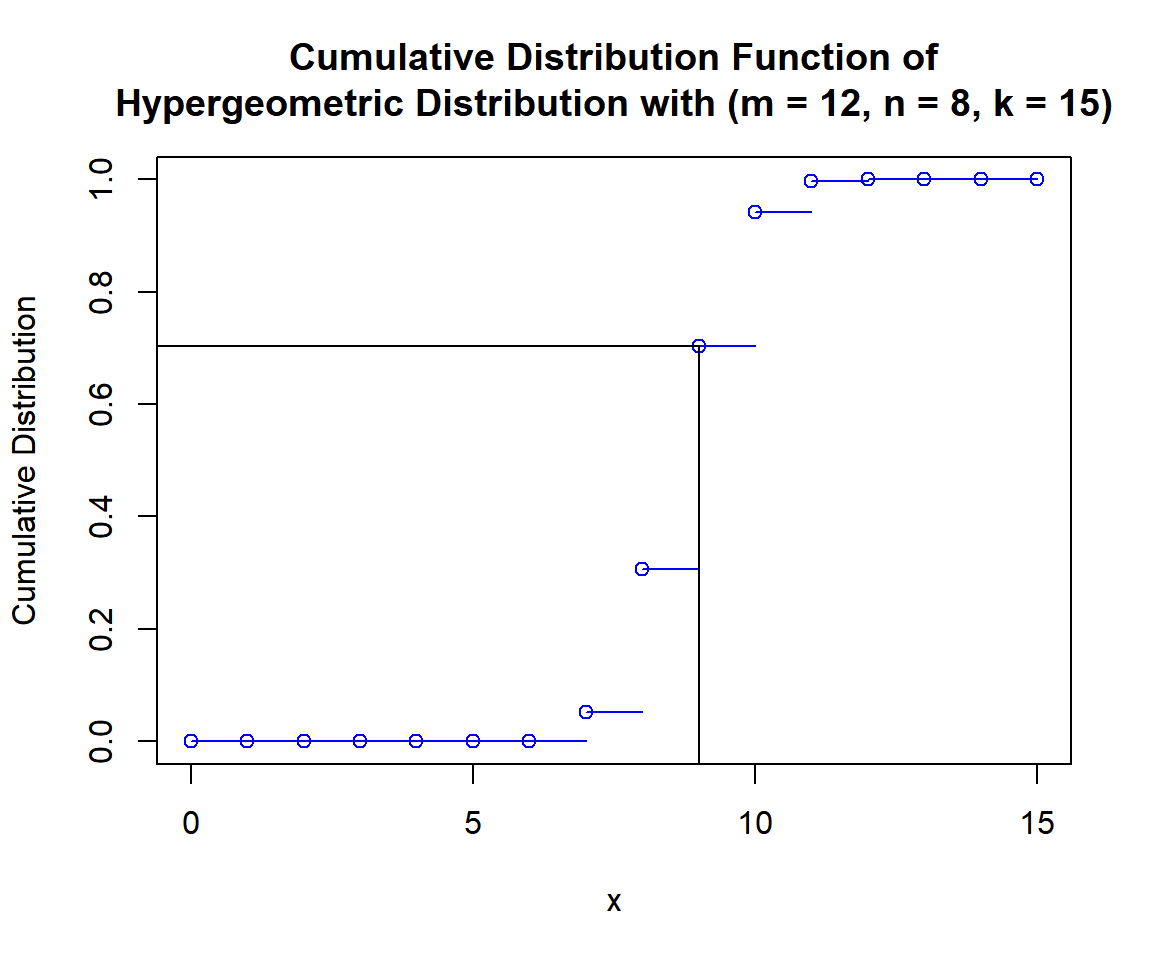
Cumulative Distribution Function (CDF) of Hypergeometric Distribution (m = 12, n = 8, k = 15) in R
For upper tail, at \(x = 9\), that is, \(P(X > 9) = 1 - P(X \le 9)\), set the "lower.tail" argument:
[1] 0.29618167 qhyper(): Derive Quantile for Hypergeometric Distributions in R
Derive the quantile for \(p = 0.85\), in the hypergeometric distribution with \(m=25\) (white), \(n=30\) (black), and \(k=20\). That is, the \(\tt{smallest}\) \(x\) such that, \(P(X\le x) \ge 0.85\):
[1] 11x = 0:20; y = phyper(x, 25, 30, 20)
plot(x, y,
xlim = c(0, 20), ylim = c(0, 1),
main = "Cumulative Distribution Function of
Hypergeometric Distribution with (m = 25, n = 30, k = 20)",
xlab = "x", ylab = "Cumulative Distribution",
col = "blue")
# Add lines
for(i in 1:20){
segments(x[i], phyper(x[i], 25, 30, 20),
x[i] + 1, phyper(x[i], 25, 30, 20),
col = "blue")
}
segments(11, -1, 11, 0.85)
segments(-1, 0.85, 11, 0.85)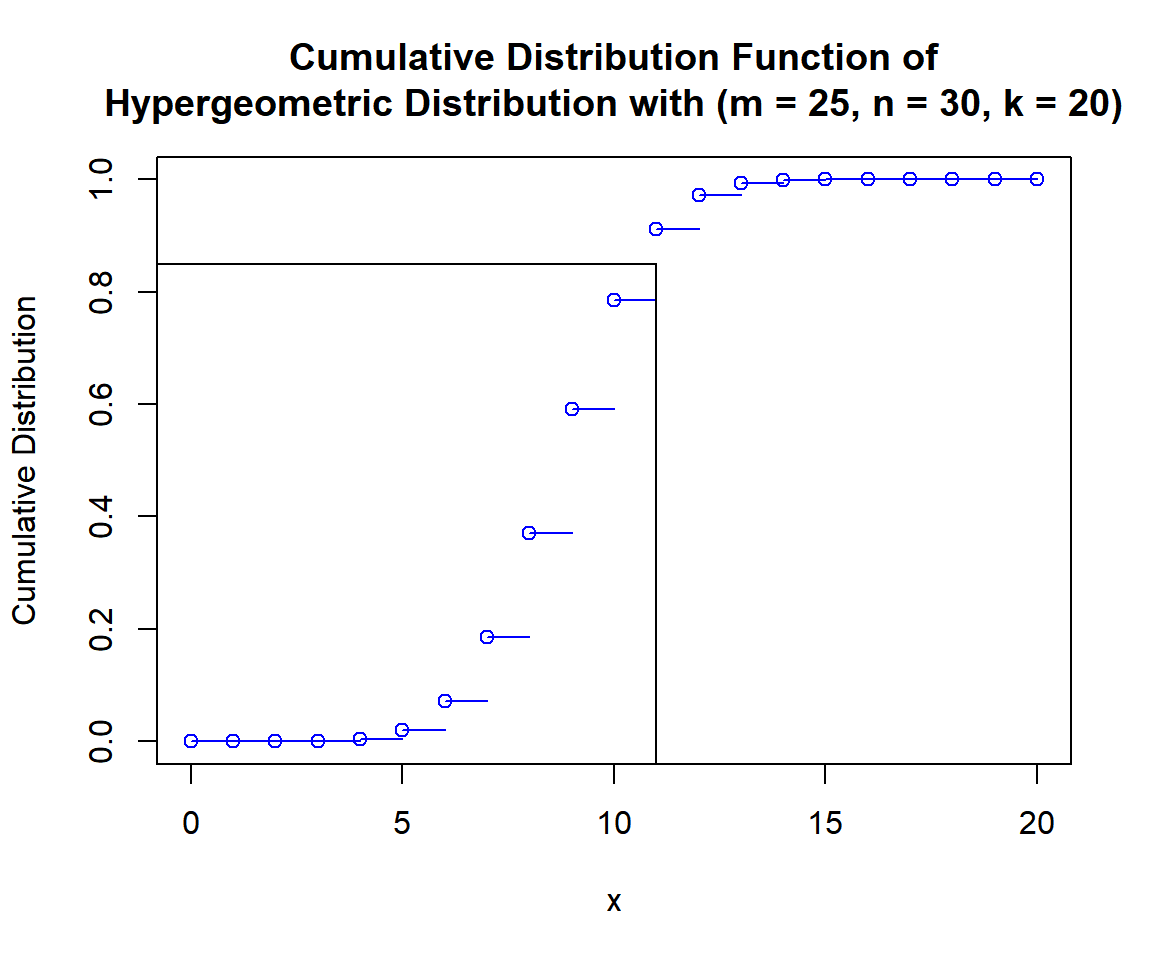
Cumulative Distribution Function (CDF) of Hypergeometric Distribution (m = 25, n = 30, k = 20) in R
For upper tail, for \(p = 0.15\), that is, the \(\tt{smallest}\) \(x\) such that, \(P(X > x) < 0.15\):
Note: \(P(X > x) = 1-P(X \le x)\).
[1] 11The feedback form is a Google form but it does not collect any personal information.
Please click on the link below to go to the Google form.
Thank You!
Go to Feedback Form
Copyright © 2020 - 2026. All Rights Reserved by Stats Codes