Line Charts in R
- 1 Create a Simple Line Chart in R
- 2 Add Dates to a Line Chart in R
- 3 Set Title, Labels, Limits, Colors, Line Types & Widths, Fonts of a Line Chart in R
- 4 Multiple Line Charts in One Plot in R
- 5 Create a Line Chart with Dots in R
- 6 Create a Vertical Line Chart in R
- 7 Create a Stairs or Steps Line Chart in R
Here, we show how to create line charts and multiple line charts in R, and set title, labels, limits, colors, line types & widths, and fonts.
These are done with the plot() function and the argument
type = "l".
See plots & charts and line types & widths for graphical parameters and other plots and charts.
1 Create a Simple Line Chart in R
Enter the data by hand:
Linedata = c(162, 150, 142, 126, 149, 195, 82, 194, 111, 122)
plot(Linedata, type = "l", main = "Simple Line Chart")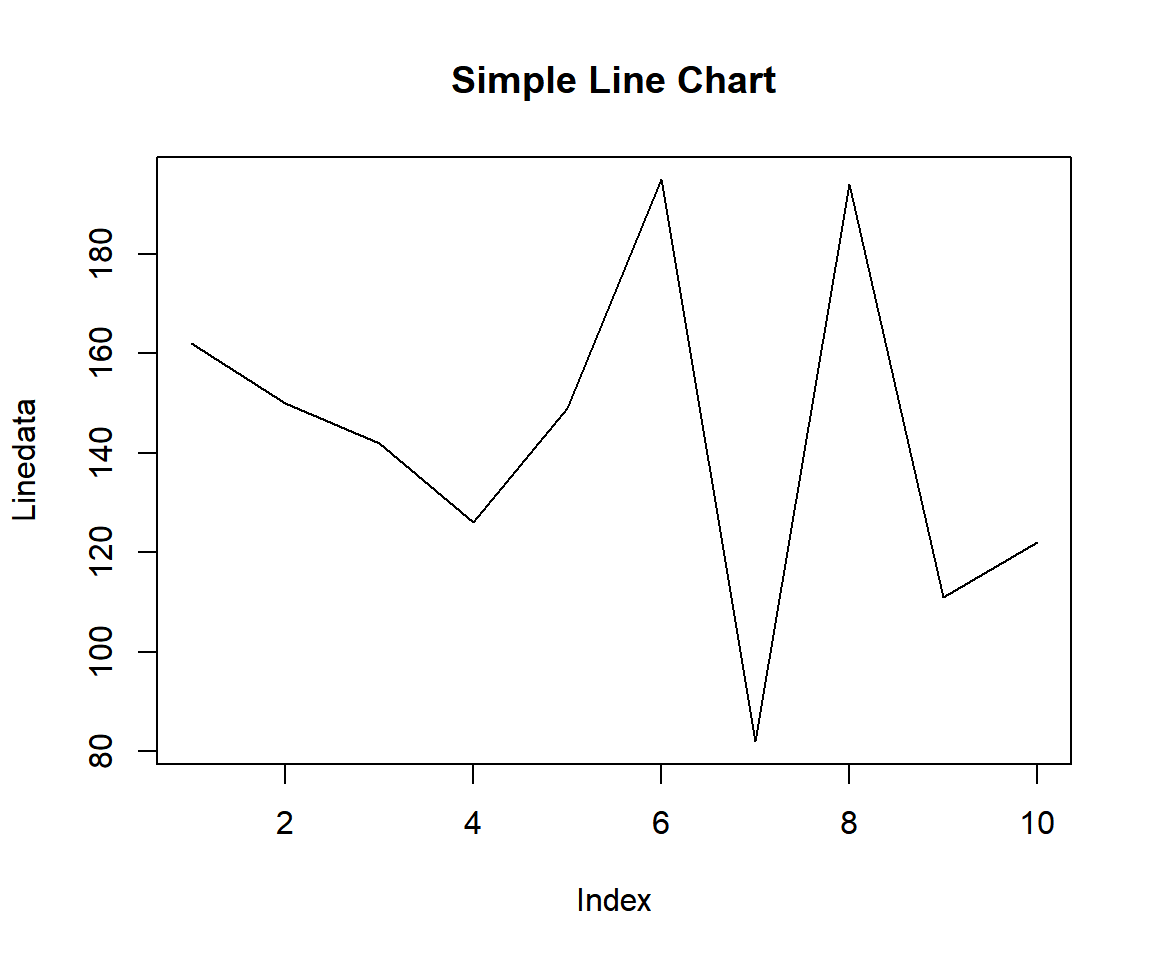
Example 1: Simple Line Chart in R
Using a Data Object:
Using the first 20 values of the Nile data from the "datasets" package with some sub-setting and filtering.
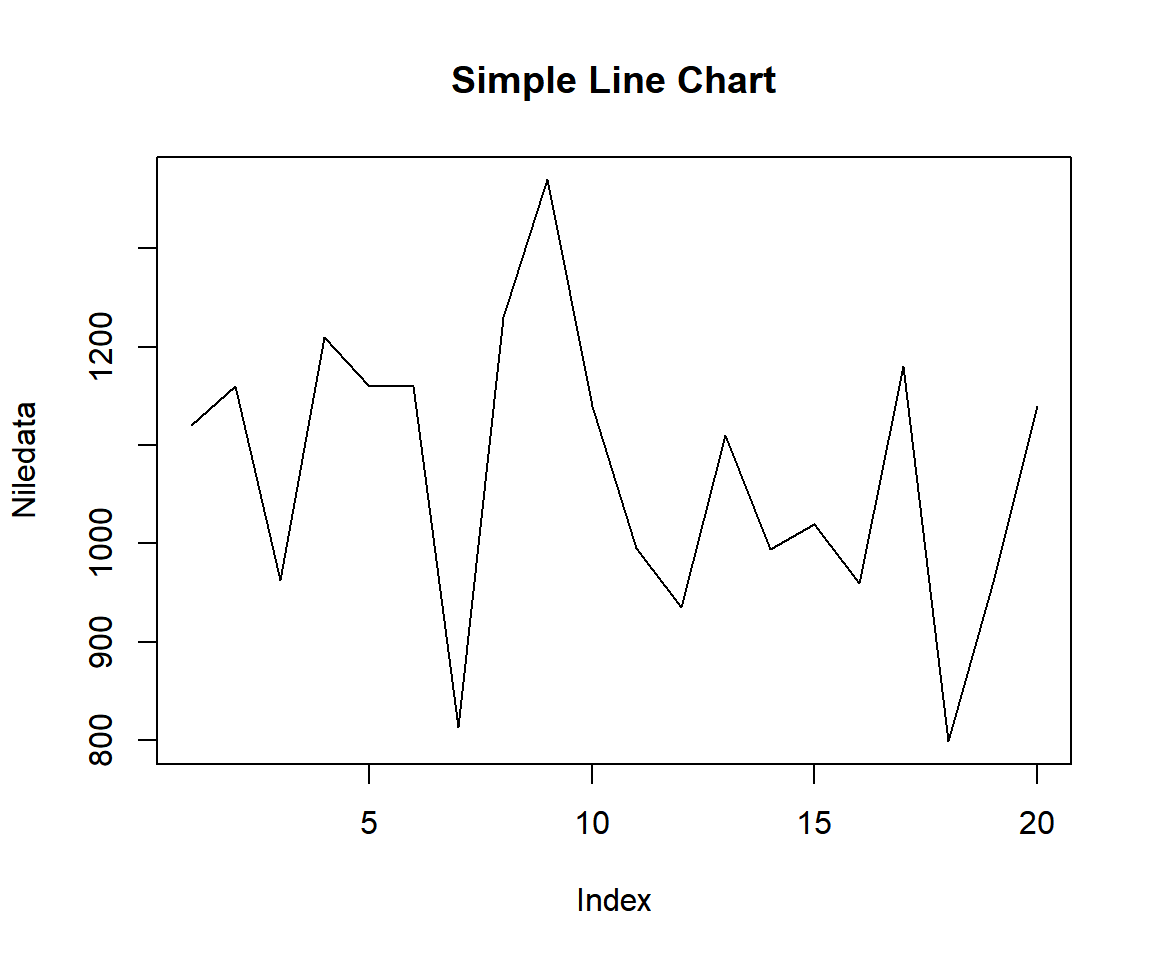
Example 2: Simple Line Chart in R
2 Add Dates to a Line Chart in R
To add dates to a line chart, specify the dates in a vector and then plot the data by the dates’ vector.
 [1] 1120 1160  963 1210 1160 1160  813 1230 1370 1140  995  935 1110  994 1020
[16] 960 1180 799 958 1140 [1] "1871" "1872" "1873" "1874" "1875" "1876" "1877" "1878" "1879" "1880"
[11] "1881" "1882" "1883" "1884" "1885" "1886" "1887" "1888" "1889" "1890"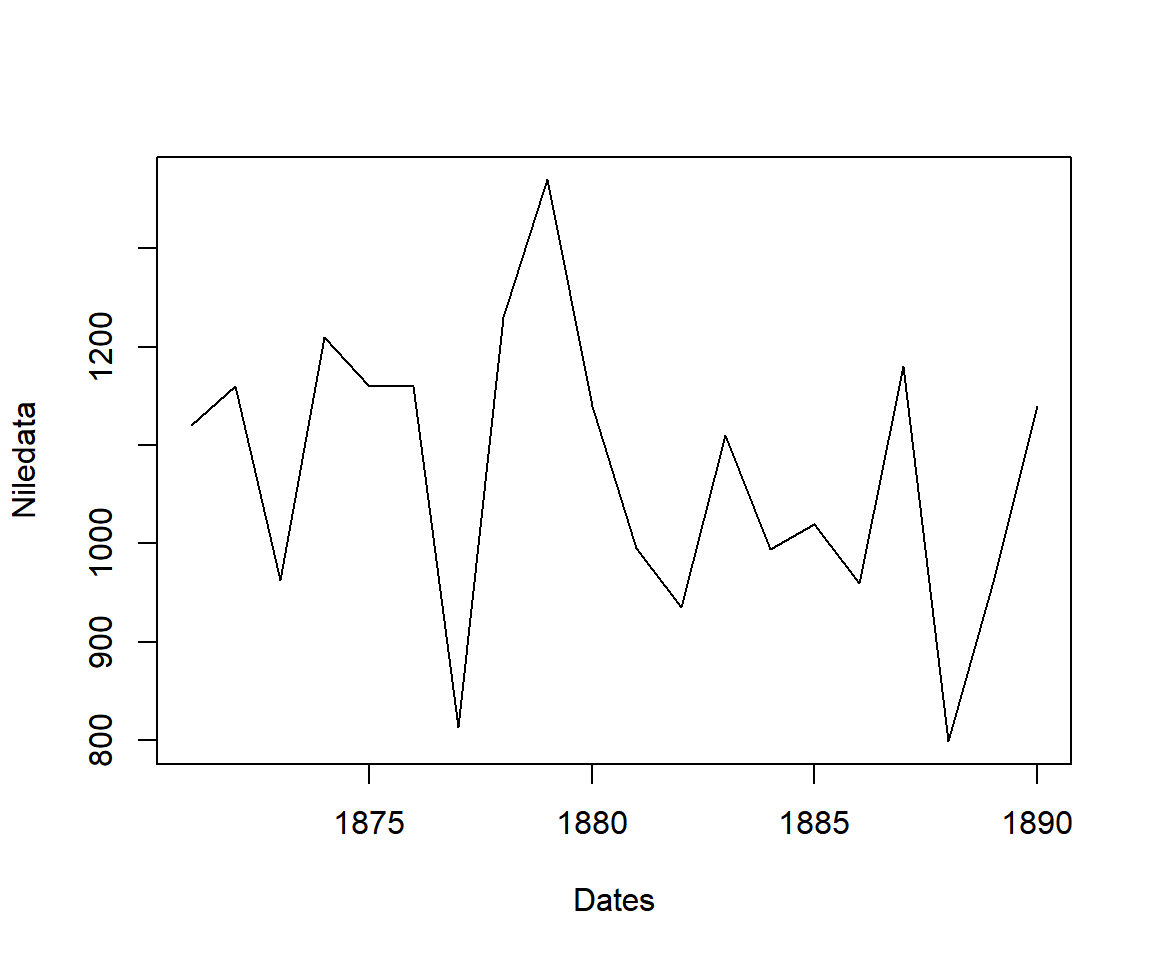
Line Chart with Dates in R
3 Set Title, Labels, Limits, Colors, Line Types & Widths, Fonts of a Line Chart in R
Here we set details such as title (main), x-axis and y-axis labels (xlab, ylab), limits (ylim), colors (col), line types (lty), line widths (lwd), font types (font), and font sizes (cex). See also setting colors and fonts for more details.
Niledata1 = Nile[1:20]
Dates = as.character(1871:1890)
plot(Niledata1 ~ Dates, type = "l",
     main = "Flow of the River Nile",
     xlab = "Year",
     ylab = "Flow",
     ylim = c(0, 2000),
     col = "blue",
     lty = 2, lwd = 3,
     col.main="green", col.lab="brown", col.axis="cyan",
     font=2, font.lab=4, font.main=3,
     cex.main=1.75, cex.lab=1.4, cex.axis=1.2)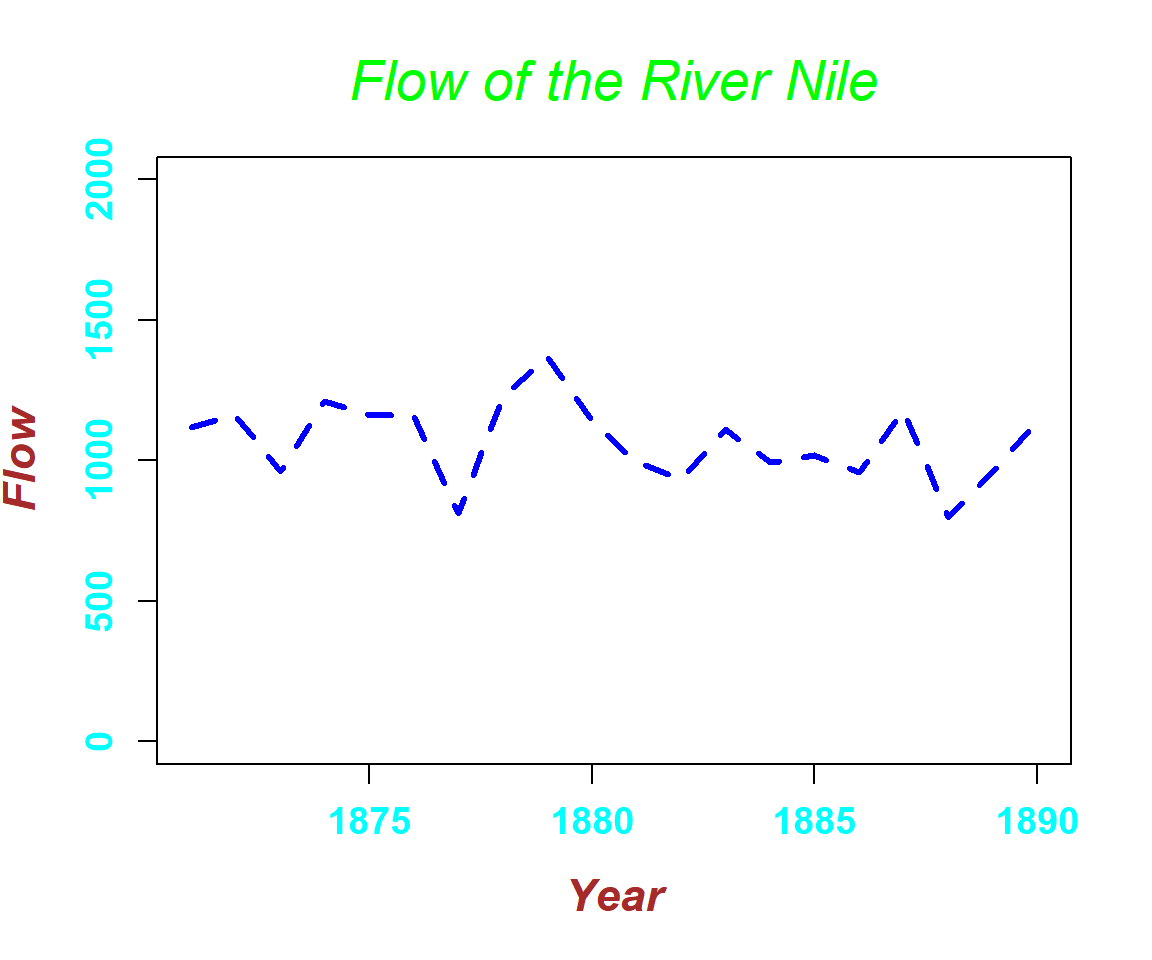
Line Chart with Title, Labels, Limits, Colors, Line Types & Widths, Fonts Set in R
4 Multiple Line Charts in One Plot in R
To plot multiple lines in one plot, use the lines()
function. You can add details to the plots as with the examples above.
See also multiple plots
on the same graph.
Niledata1 = Nile[1:20]
Niledata2 = Nile[21:40]

plot(Niledata1, type = "l", col = "blue", lty = 5, lwd = 3)
lines(Niledata2, col = "red", lty = 2, lwd = 1)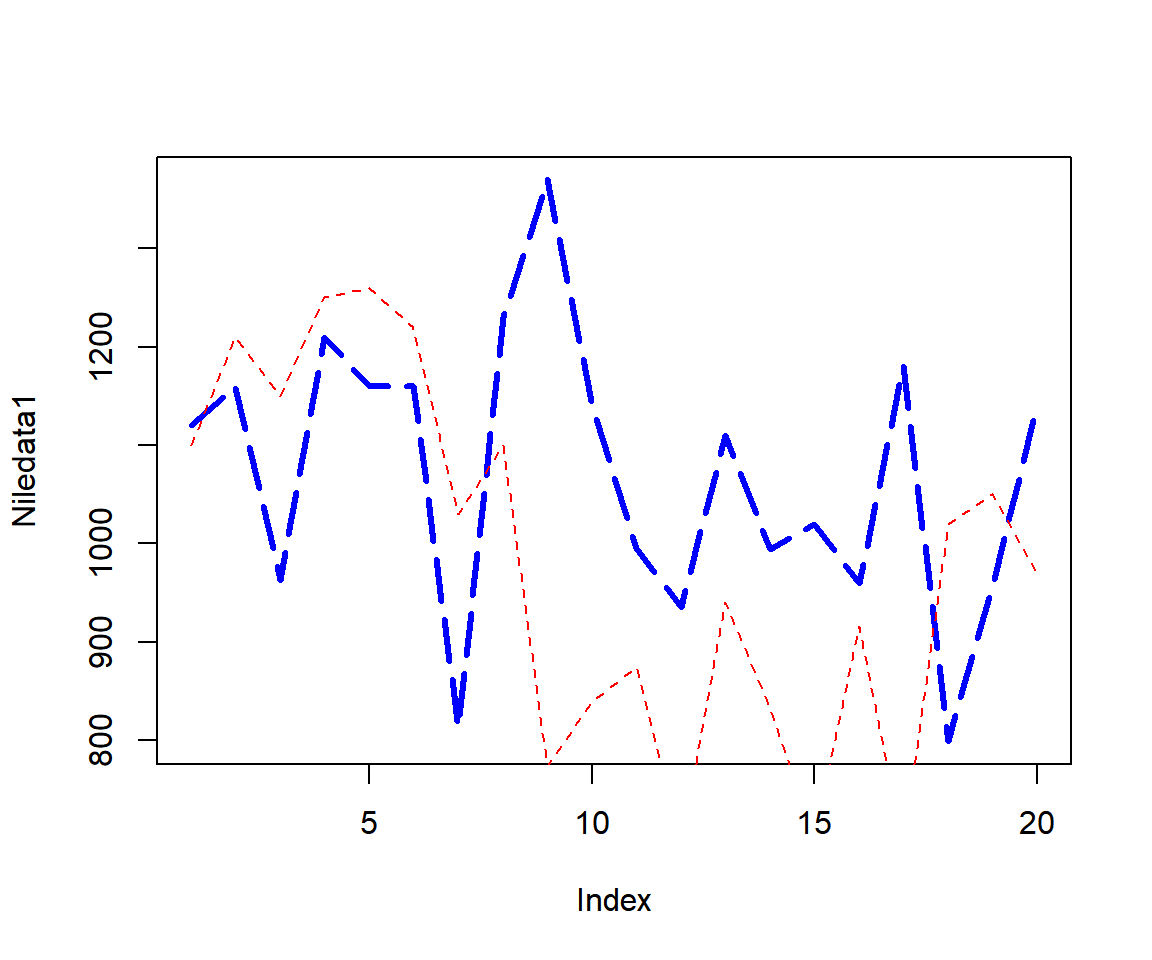
Example 1: Multiple Line Charts in One Plot in R
Adjust the axes limits to accommodate for the limits of the added line.
plot(Niledata1, type = "l",
     ylim = range(c(Niledata1, Niledata2)),
     col = "blue",
     lty = 5, lwd = 3)
lines(Niledata2, col = "red", lty = 2, lwd = 1)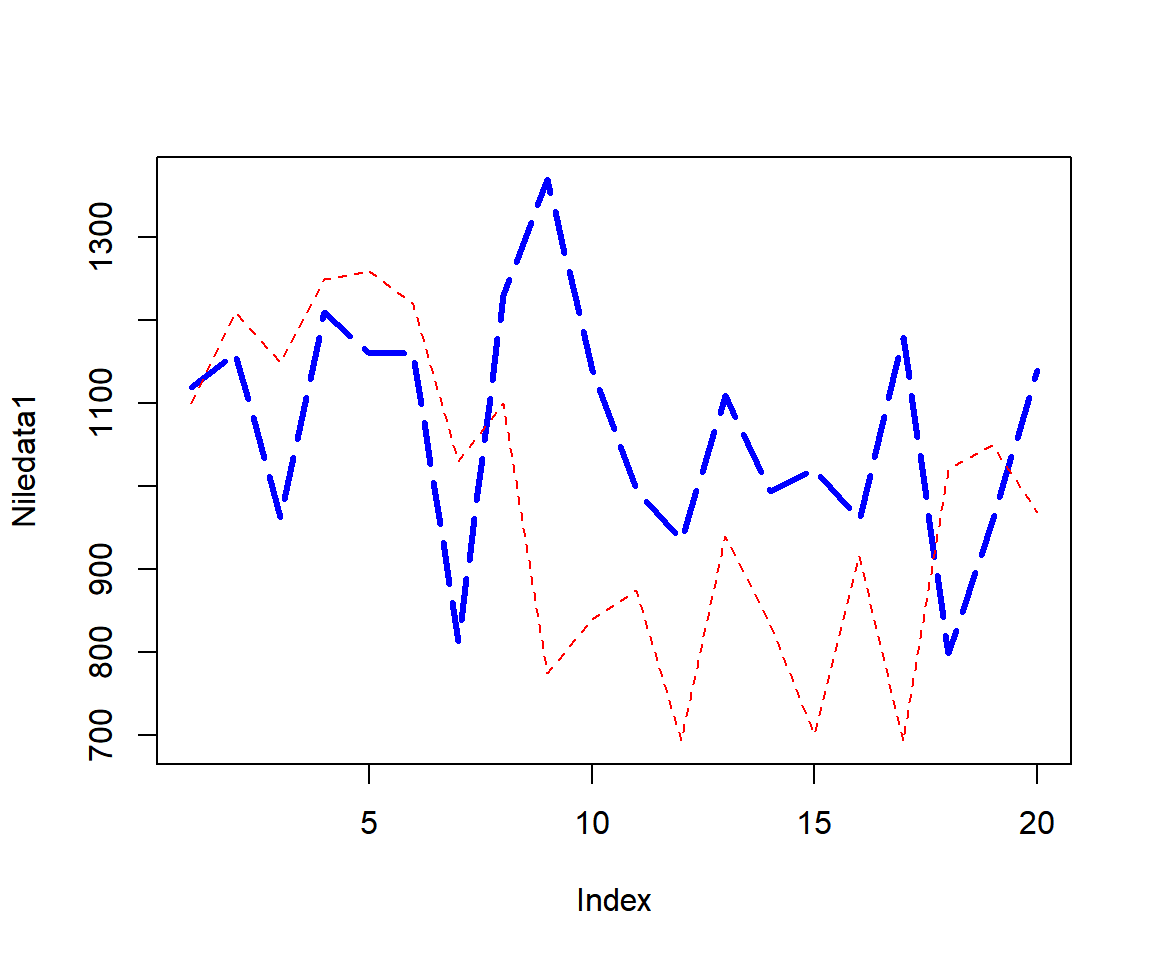
Example 2: Multiple Line Charts in One Plot in R
5 Create a Line Chart with Dots in R
To create a line chart with dots, set the "type" argument to "b" for disconnected lines and dots, or to "o" if you want the lines and the dots to connect. You can add details to the plots as with the examples above.
See Niledata data above.
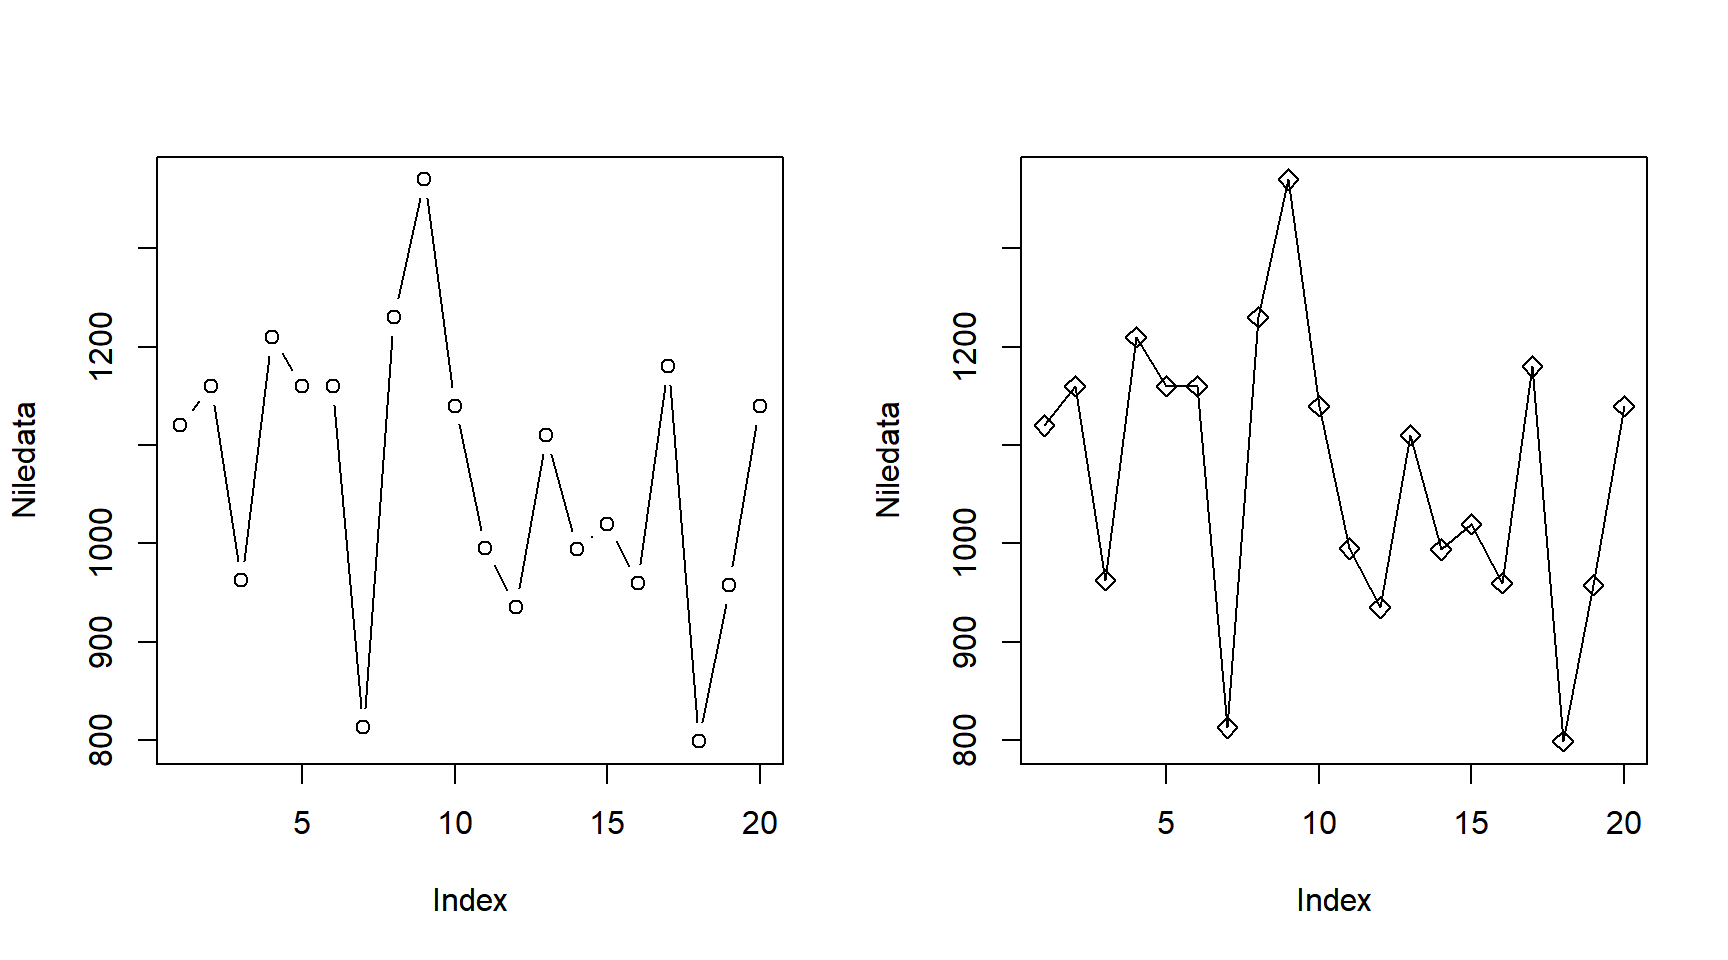
Line Chart with Dots in R
6 Create a Vertical Line Chart in R
To create a vertical or histogram-like line chart, set the "type" argument to "h". You can add details to the plot as with the examples above.
See Niledata data above.
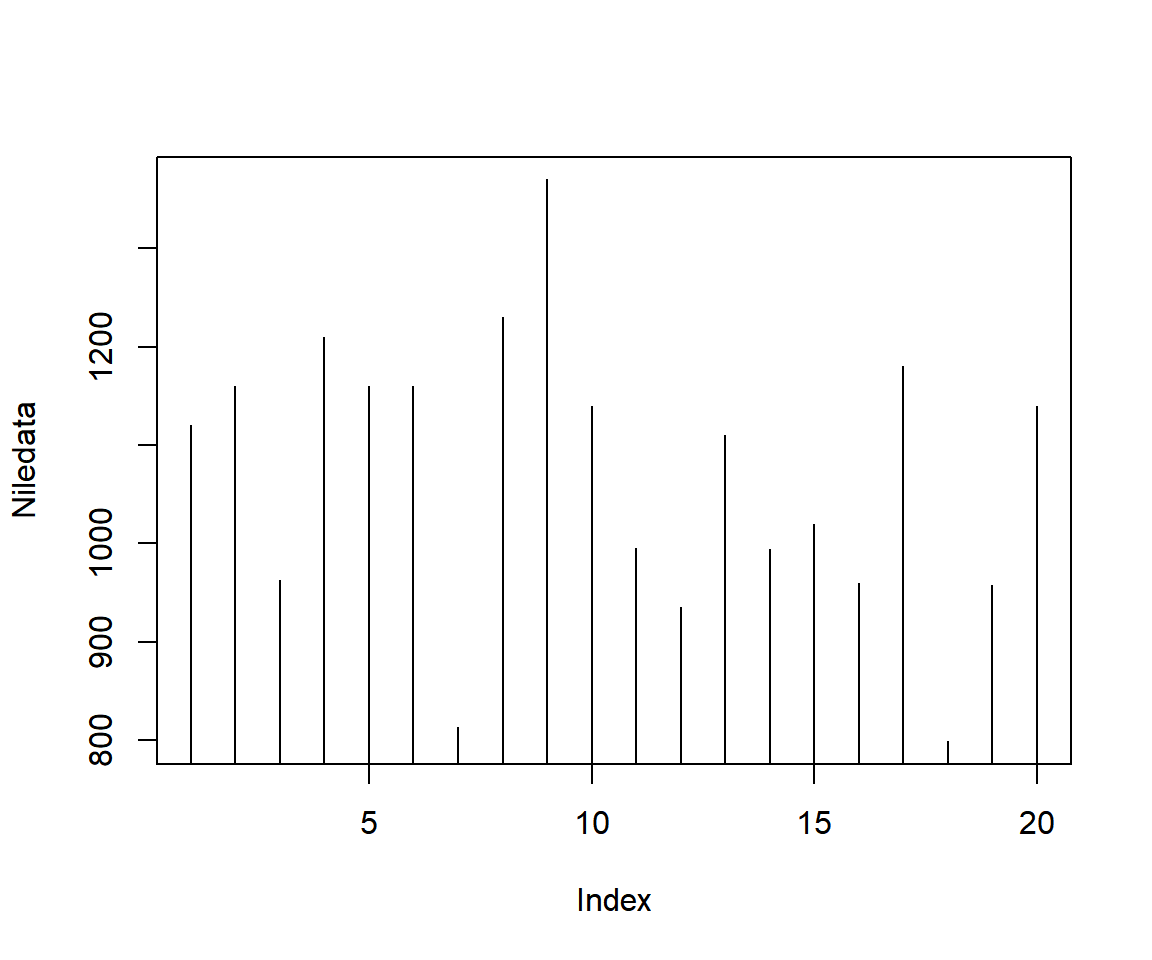
Vertical Line Chart in R
7 Create a Stairs or Steps Line Chart in R
To create a stairs or steps line chart, set the "type" argument to "s" for connection at the level of the previous value, or to "S" if you want connection at the level of the next value. You can add details to the plots as with the example above.
See Niledata data above.
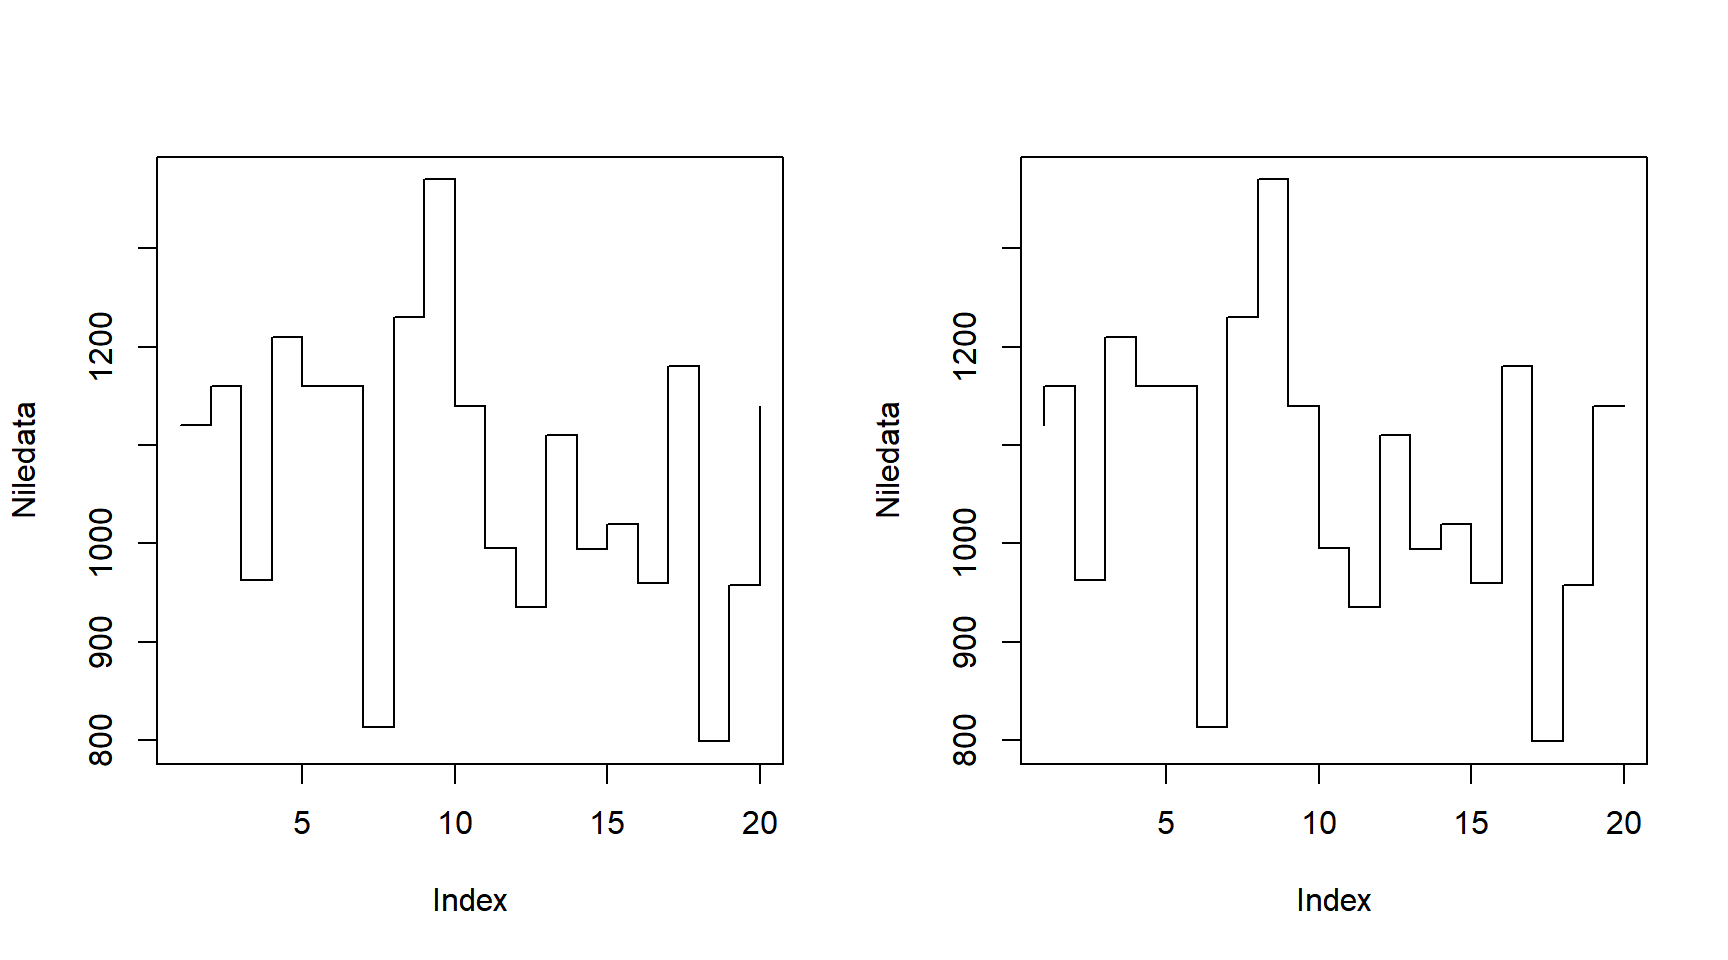
Stairs or Steps Line Charts in R
The feedback form is a Google form but it does not collect any personal information.
Please click on the link below to go to the Google form.
Thank You!
Go to Feedback Form
Copyright © 2020 - 2026. All Rights Reserved by Stats Codes