Add Lines, Segments and Arrows on Plots & Charts in R
Here, we discuss how to add lines and draw line segments on plots in R, including joining two or multiple points with lines, and lines with arrows.
These will be done using the lines(),
segments(), abline(), and
arrows() functions. All the functions are from the
"graphics" package.
See also line charts, line types & widths and point types & sizes.
| Argument | Usage |
| col | Set line color |
| lwd | Set line width |
| lty | Set line type |
1 Joining Two Points on Plots & Charts in R
Here we show how to join two points with a line using both the
lines() and segments() functions.
Points to be joined:
Points (2, 3) to (5, 4) using lines, and (4, 9) to (7, 5) using segments.
plot(10, 10, pch = "",
     xlim = c(0,10), ylim = c(0,10),
     xlab = "", ylab = "",
     main = "Joining Two Points on Plots & Charts")

points(c(2, 5), c(3, 4))
text(2, 3, "(2, 3)", adj = c(0.5, 1.5))
text(5, 4, "(5, 4)", adj = c(0.5, -1))

points(c(4, 7), c(9, 5))
text(4, 9, "(4, 9)", adj = c(0.5, -1))
text(7, 5, "(7, 5)", adj = c(0.5, 1.5))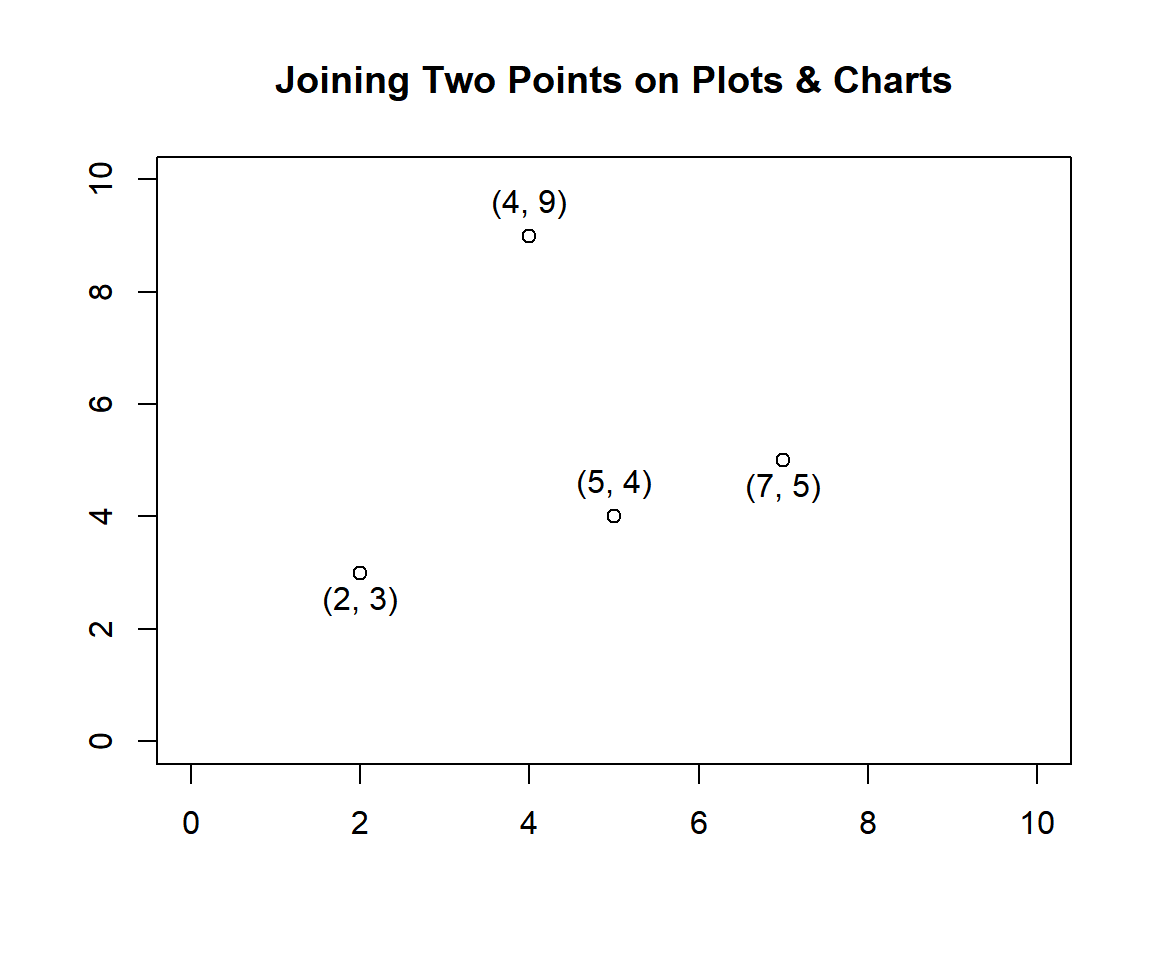
Joining Two Points on Plots & Charts in R
With the points highlighted, join the points with the following codes:
# Specify the two x and the two y points.
lines(x = c(2, 5), y = c(3, 4), col = "blue")

# Specify x0, y0, x1 and y1 points.
segments(x0 = 4, y0 = 9, x1 = 7, y1 = 5, col = "red")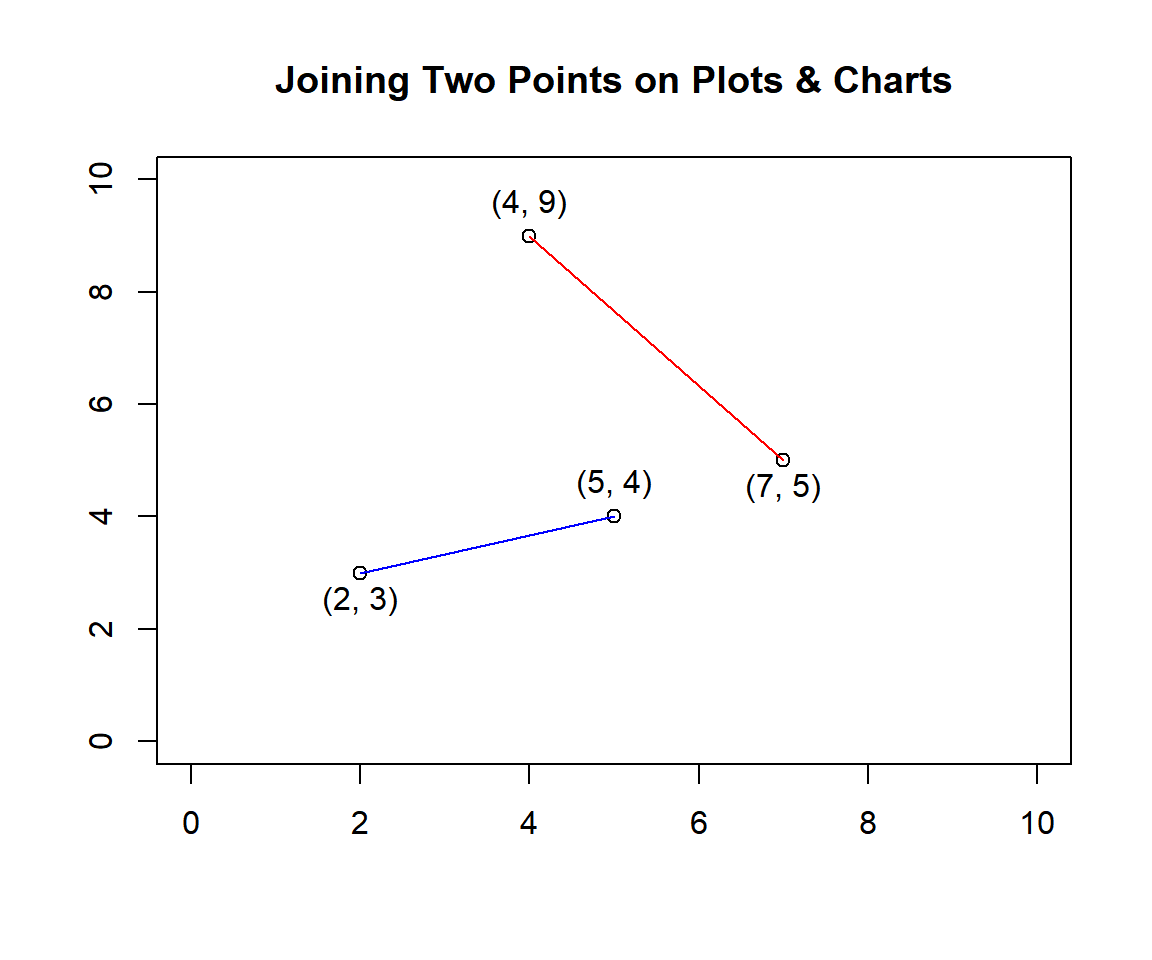
Joining Two Points on Plots & Charts in R
2 Joining Multiple Points on Plots & Charts in R
Here we show how to join multiple points with lines using both the
lines() and segments() functions.
Points to be joined:
Points (0, 2) to (2, 4) to (6, 2) to (8, 2) using lines, and (2, 10) to (6, 8) to (8, 6) to (10, 8) using segments.
plot(12, 12, pch = "",
     xlim = c(-0.5, 12), ylim = c(0,12),
     xlab = "", ylab = "",
     main = "Joining Multiple Points on Plots & Charts in R")

points(c(0, 2, 6, 8), c(2, 4, 2, 2), col = "blue")
text(0, 2, "(0, 2)", adj = c(0.5, 1.5))
text(2, 4, "(2, 4)", adj = c(0.5, -1))
text(6, 2, "(6, 2)", adj = c(0.5, 1.5))
text(8, 2, "(8, 2)", adj = c(0.5, 1.5))

points(c(2, 6, 8, 10), c(10, 8, 6, 8), col = "red")
text(2, 10, "(2, 10)", adj = c(0.5, -1))
text(6, 8, "(6, 8)", adj = c(0.5, -1))
text(8, 6, "(8, 6)", adj = c(0.5, 1.5))
text(10, 8, "(10, 8)", adj = c(0.5, -1))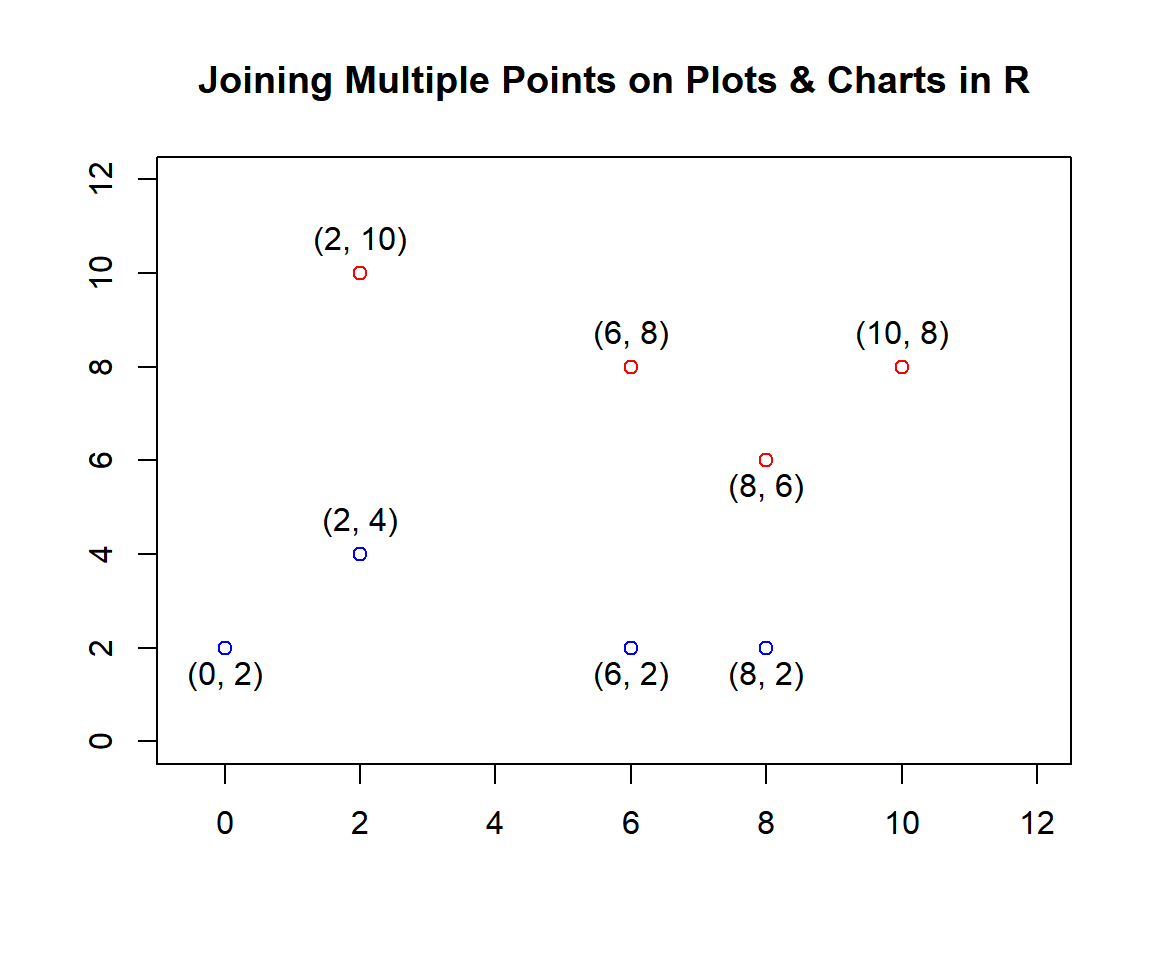
Joining Multiple Points on Plots & Charts in R
With the points highlighted, join the points with the following codes:
# Specify the four x and the four y points.
lines(x = c(0, 2, 6, 8), y = c(2, 4, 2, 2),
      lty = 2, col = "blue")

# Specify the three x0, y0, x1 and y1 points.
segments(x0 = c(2, 6, 8), y0 = c(10, 8, 6),
         x1 = c(6, 8, 10), y1 = c(8, 6, 8),
         lty = 4, col = "red")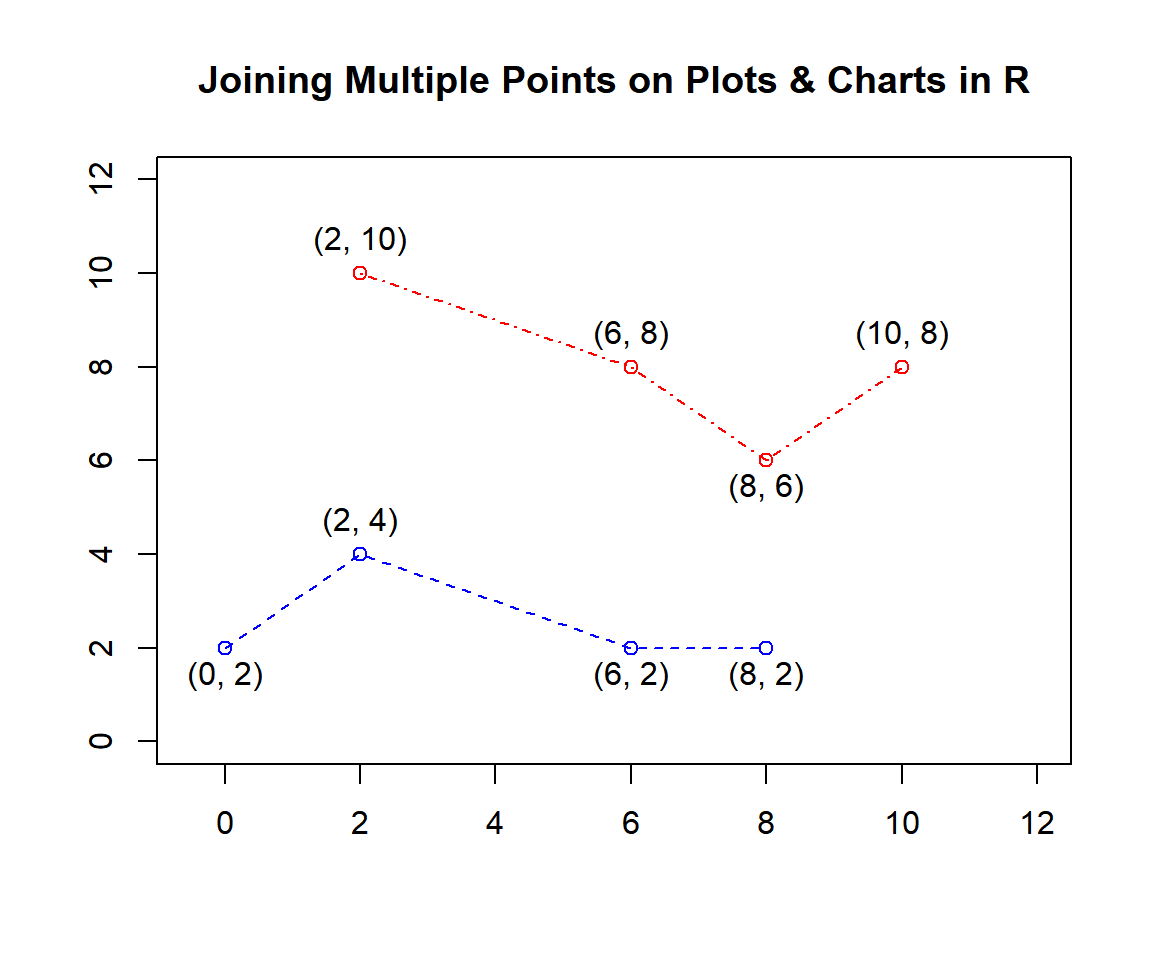
Joining Multiple Points on Plots & Charts in R
3 Add Horizontal Lines to Plots & Charts in R
Here we show how to add horizontal lines to plots & charts using
the abline() function.
The examples below adds lines at \(y=(2, 4, 6, 8, 10)\).
plot(12, 12, pch = "",
     xlim = c(0, 12), ylim = c(0, 12),
     xlab = "", ylab = "",
     main = "Add Horizontal Lines to Plots & Charts in R")

abline(h = 2)
abline(h = 4, lwd = 1.5, lty = 1, col = "blue")
abline(h = 6, lwd = 2, lty = 2, col = "green")
abline(h = 8, lwd = 3, lty = 3, col = "gold")
abline(h = 10, lwd = 1, lty = 4, col = "red")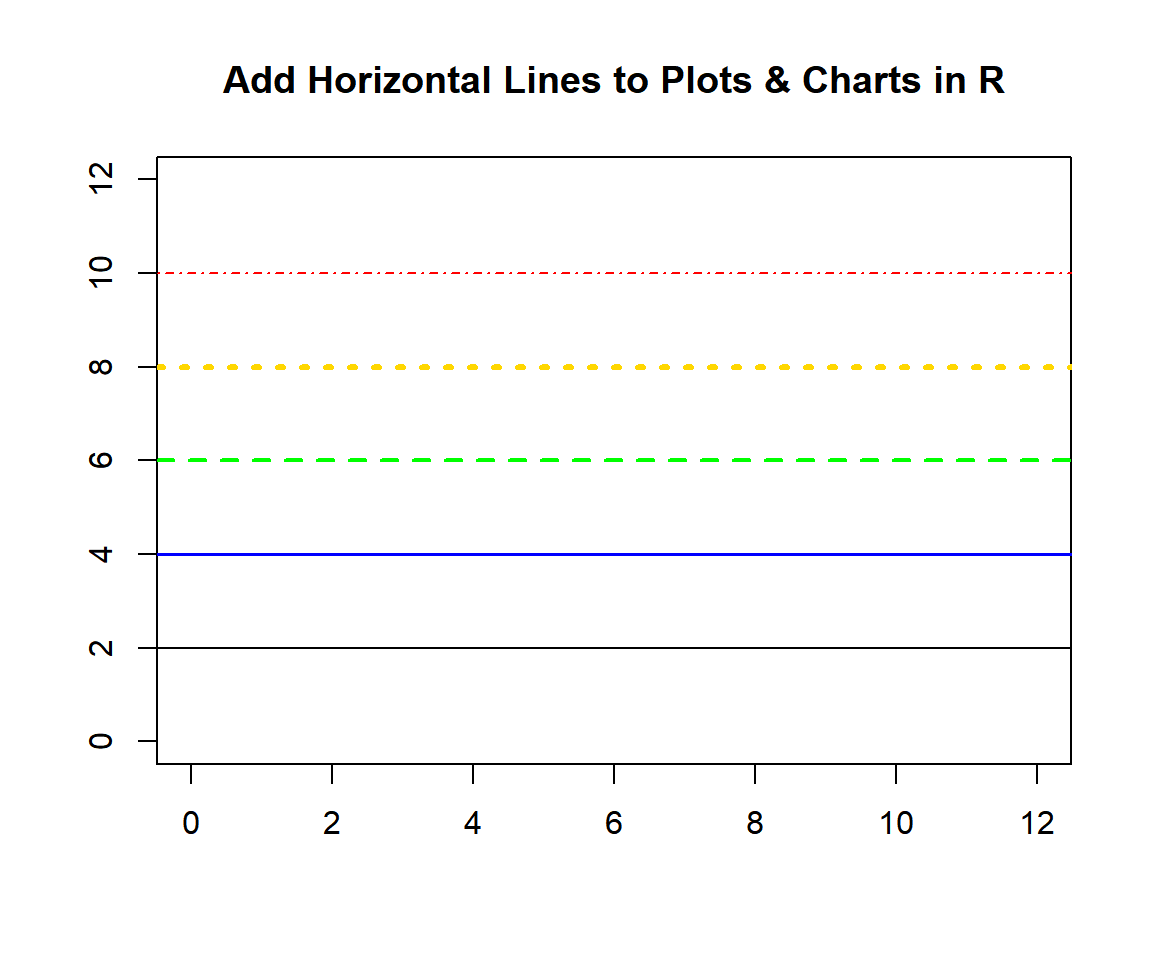
Add Horizontal Lines to Plots & Charts in R
4 Add Vertical Lines to Plots & Charts in R
Here we show how to add vertical lines to plots & charts using
the abline() function.
The examples below adds lines at \(x=(2, 4, 6, 8, 10)\).
plot(12, 12, pch = "",
     xlim = c(0, 12), ylim = c(0, 12),
     xlab = "", ylab = "",
     main = "Add Vertical Lines to Plots & Charts in R")

abline(v = 2)
abline(v = 4, lwd = 2, lty = 1, col = "green")
abline(v = 6, lwd = 1.5, lty = 2, col = "blue")
abline(v = 8, lwd = 1, lty = 3, col = "red")
abline(v = 10, lwd = 3, lty = 4, col = "gold")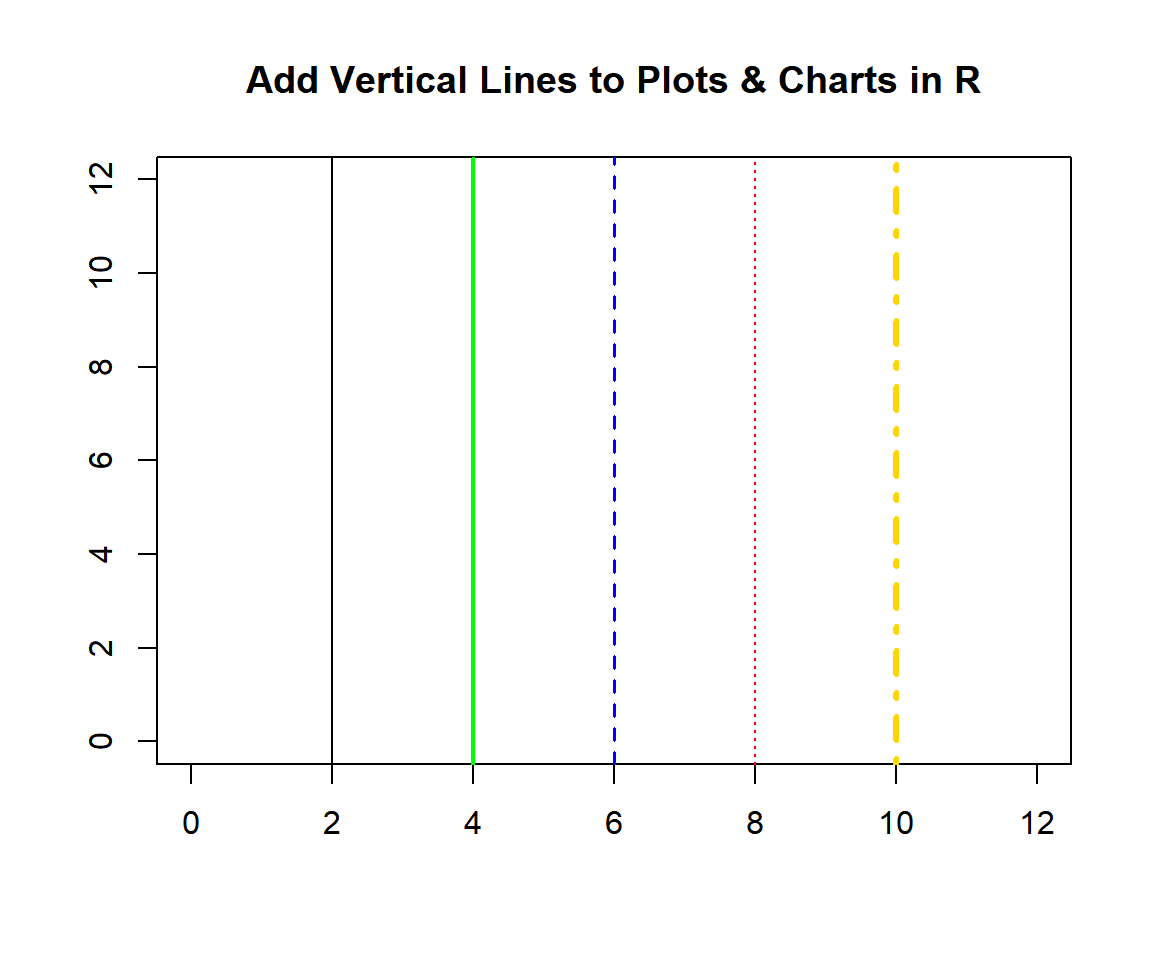
Add Vertical Lines to Plots & Charts in R
5 Add Slope Lines to Plots & Charts in R
Here we show how to add slope lines to plots & charts using the
abline() function.
The examples below adds slope lines with \((\tt{intercept} = 2,\; \tt{slope} = 0.8)\), and \((\tt{intercept} = 10,\; \tt{slope} = -0.5)\).
plot(12, 12, pch = "",
     xlim = c(0, 12), ylim = c(0, 12),
     xlab = "", ylab = "",
     main = "Add Slope Lines to Plots & Charts in R")

abline(coef = c(2, 0.8), lwd = 1.5, lty = 1, col = "red")
abline(coef = c(10, -0.5), lwd = 4, lty = 4, col = "blue")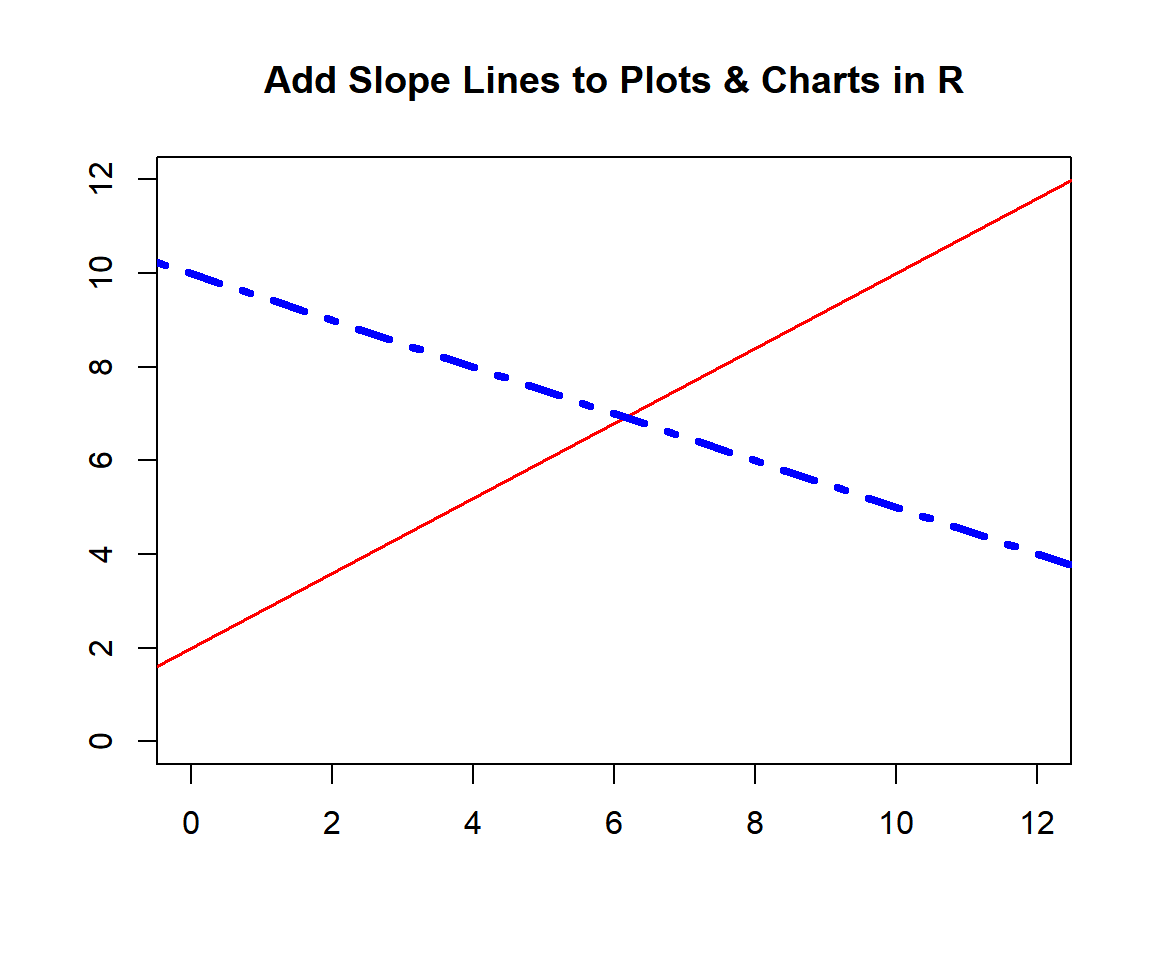
Add Slope Lines to Plots & Charts in R
6 Add Lines with Arrows on Plots & Charts in R
Here we show how to add lines with arrows using the
arrows() function.
Points to be joined with arrows:
Points (4, 2) to (6, 8) to (8, 4) to (10, 8) using arrows.
plot(12, 12, pch = "",
     xlim = c(-0.5, 12), ylim = c(0, 12),
     xlab = "", ylab = "",
     main = "Add Lines with Arrows on Plots & Charts in R")

points(c(4, 6, 8, 10), c(2, 8, 4, 8), col = "green")
text(4, 2, "(4, 2)", adj = c(0.5, 1.5))
text(6, 8, "(6, 8)", adj = c(0.5, -1))
text(8, 4, "(8, 4)", adj = c(0.5, 1.5))
text(10, 8, "(10, 8)", adj = c(0.5, -1))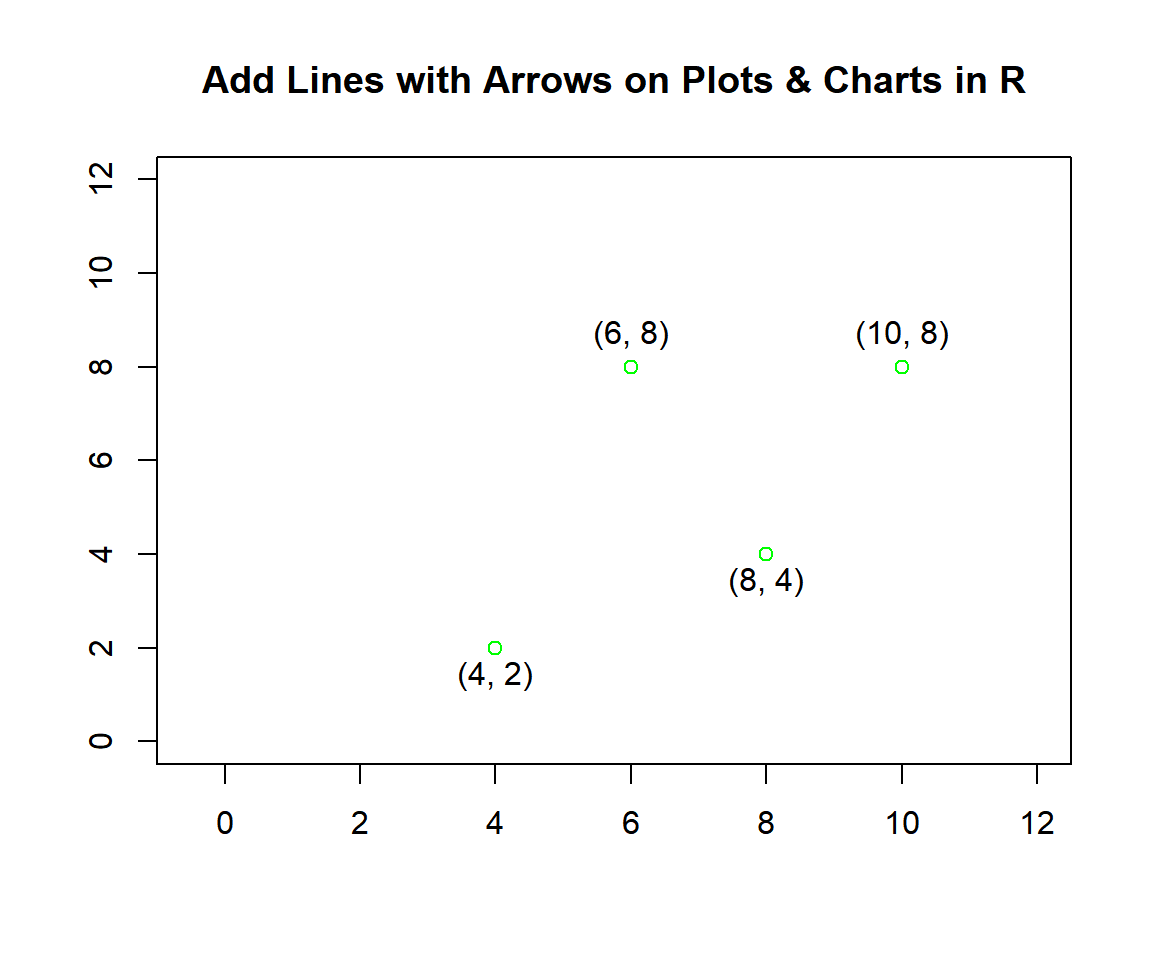
Add Lines with Arrows on Plots & Charts in R
With the points highlighted, add lines with arrows with the following codes:
# Specify the three x0, y0, x1 and y1 points.
arrows(x0 = c(4, 6, 8), y0 = c(2, 8, 4),
       x1 = c(6, 8, 10), y1 = c(8, 4, 8),
       lty = 2, col = "red")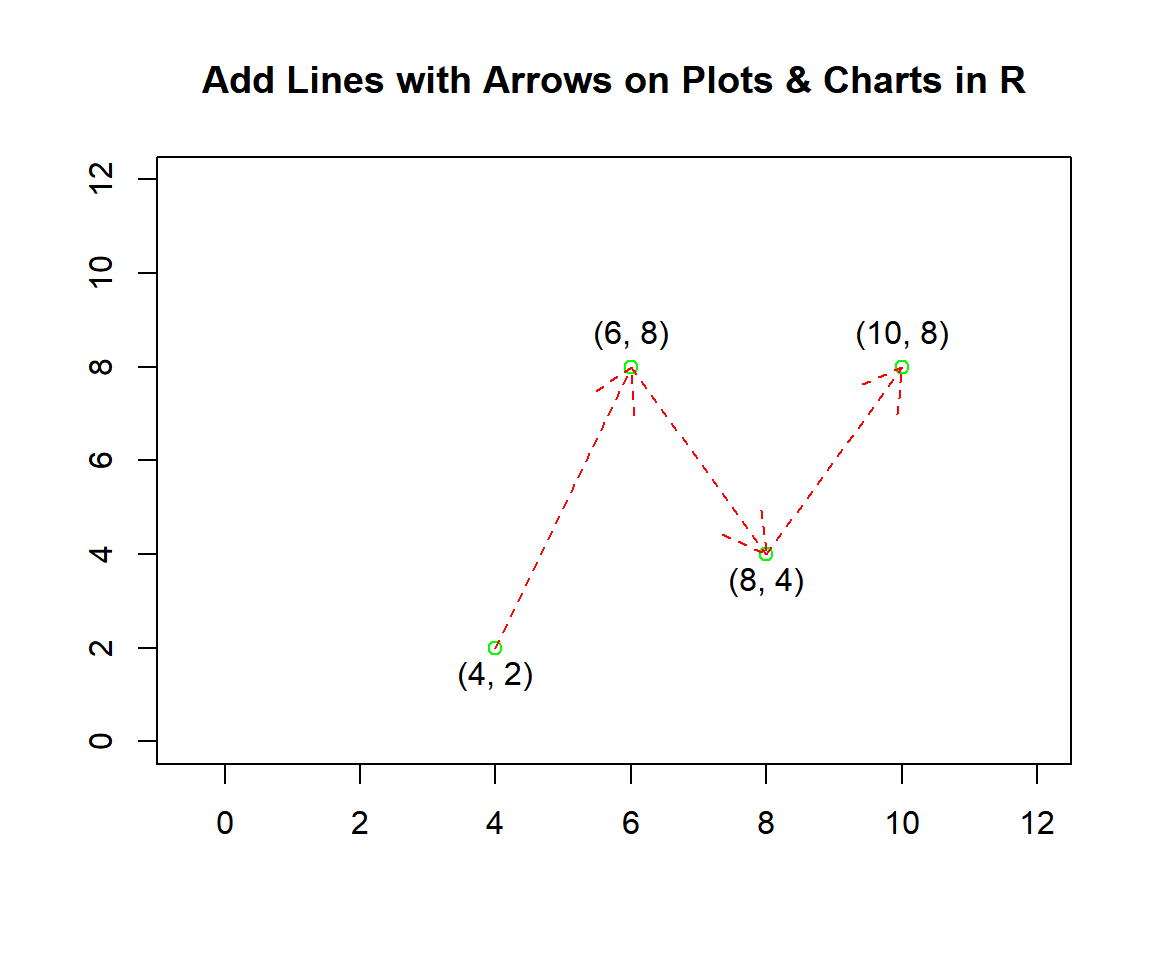
Add Lines with Arrows on Plots & Charts in R
The feedback form is a Google form but it does not collect any personal information.
Please click on the link below to go to the Google form.
Thank You!
Go to Feedback Form
Copyright © 2020 - 2026. All Rights Reserved by Stats Codes