Box Plots in R
Here, we show how to make box plots in R: side-by-side, horizontal, or two variables box plots, and set titles, labels, legends, colors, and fonts.
These are done with the boxplot() function.
See plots & charts for graphical parameters and other plots and charts.
1 Create a Simple Box Plot in R
Enter the data by hand:
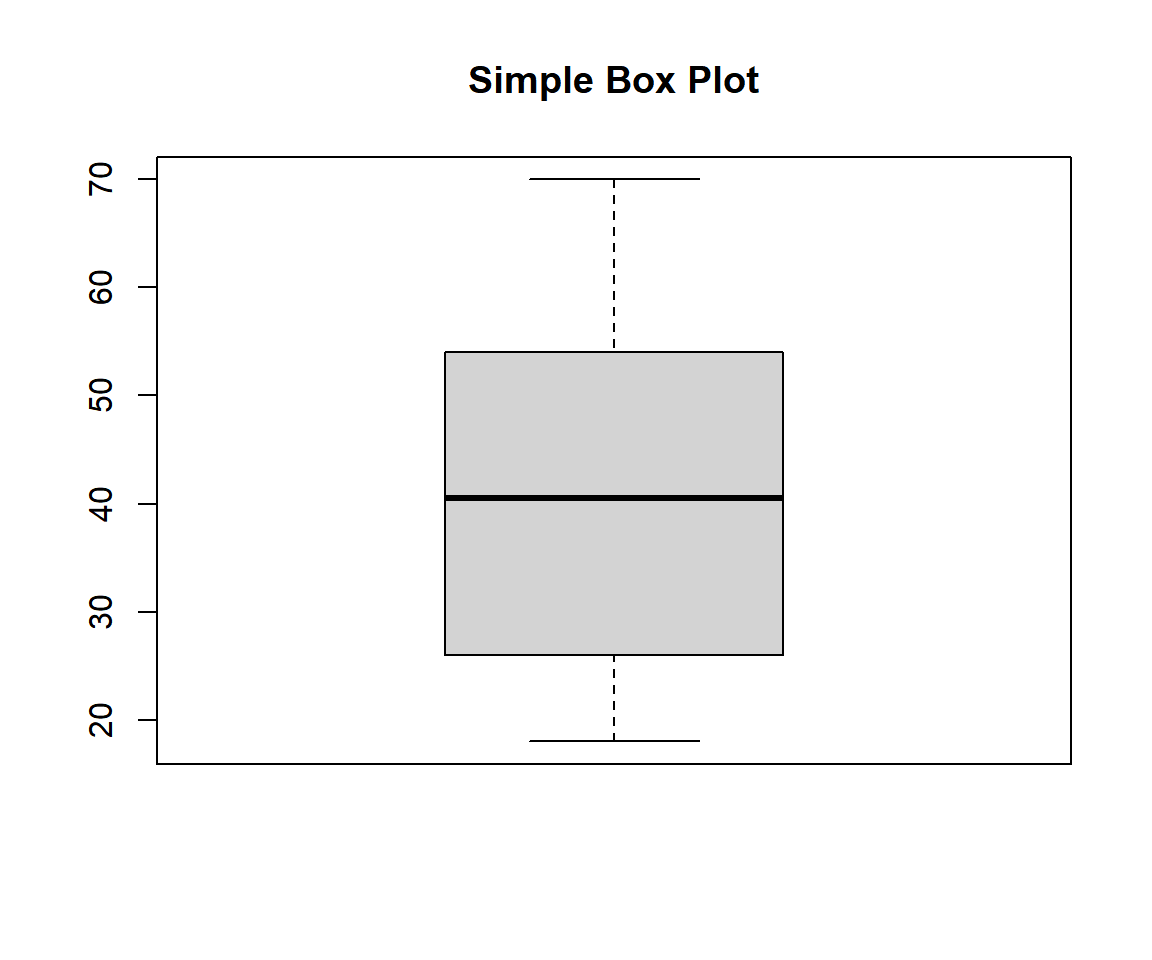
Example 1: Simple Box Plot in R
Using a Data Object:
Using the warpbreaks data from the "datasets" package with some sub-setting and filtering.
Sample rows from the warpbreaks data:
   breaks wool tension
1      26    A       L
6      52    A       L
10     18    A       M
17     30    A       M
23     10    A       H
29     14    B       L
38     26    B       M
45     29    B       M
48     24    B       H
54 28 B HOr:
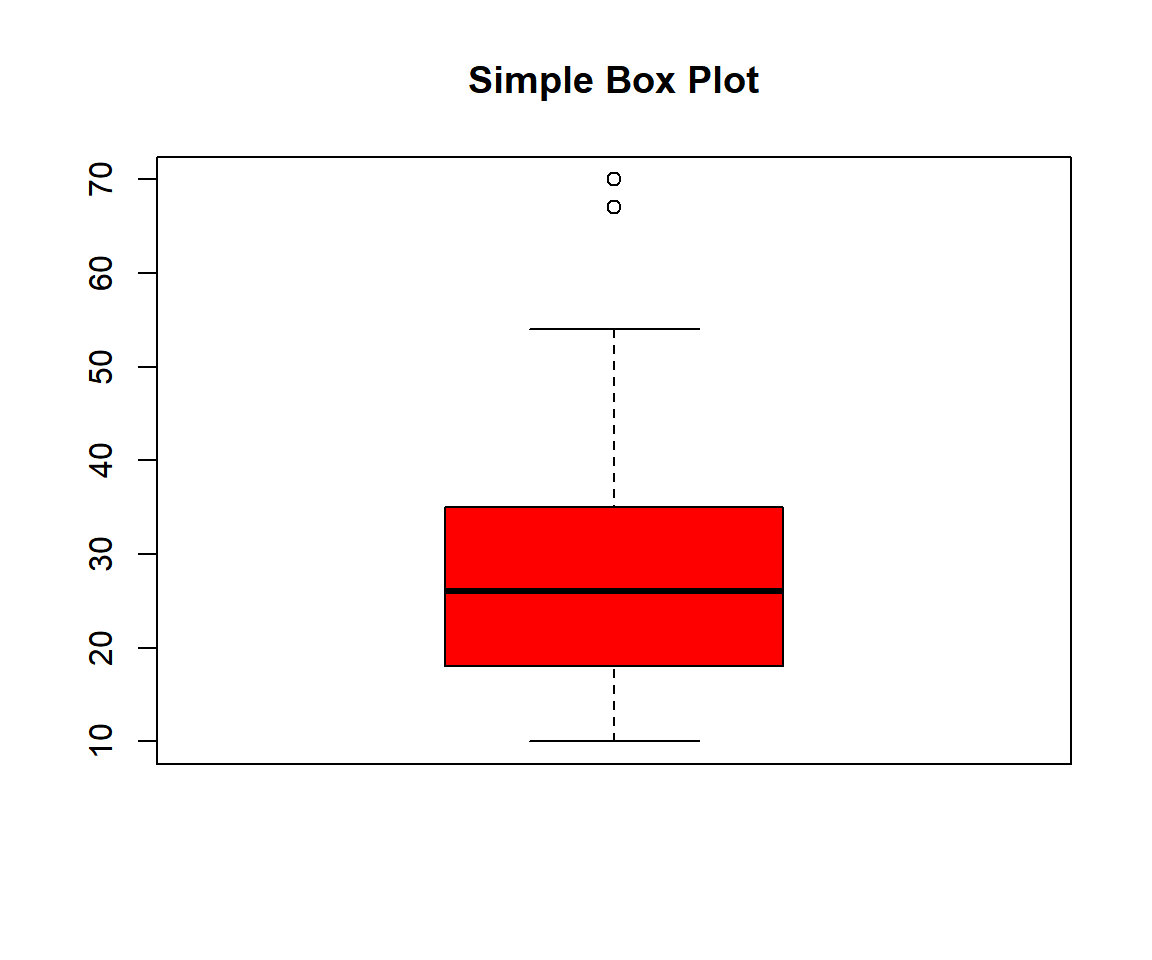
Example 2: Simple Box Plot in R
2 Create a Side-by-side Box Plot by Group in R
To create a side-by-side box plot by group, specify the plot by the variable or factor of interest.
Enter the data by hand:
Boxdata = c(26, 30, 54, 25, 70, 52, 51, 26, 67, 18)
Boxfactor = c("A", "A", "A", "A", "A", "B", "B", "B", "B", "B")
boxplot(Boxdata ~ Boxfactor)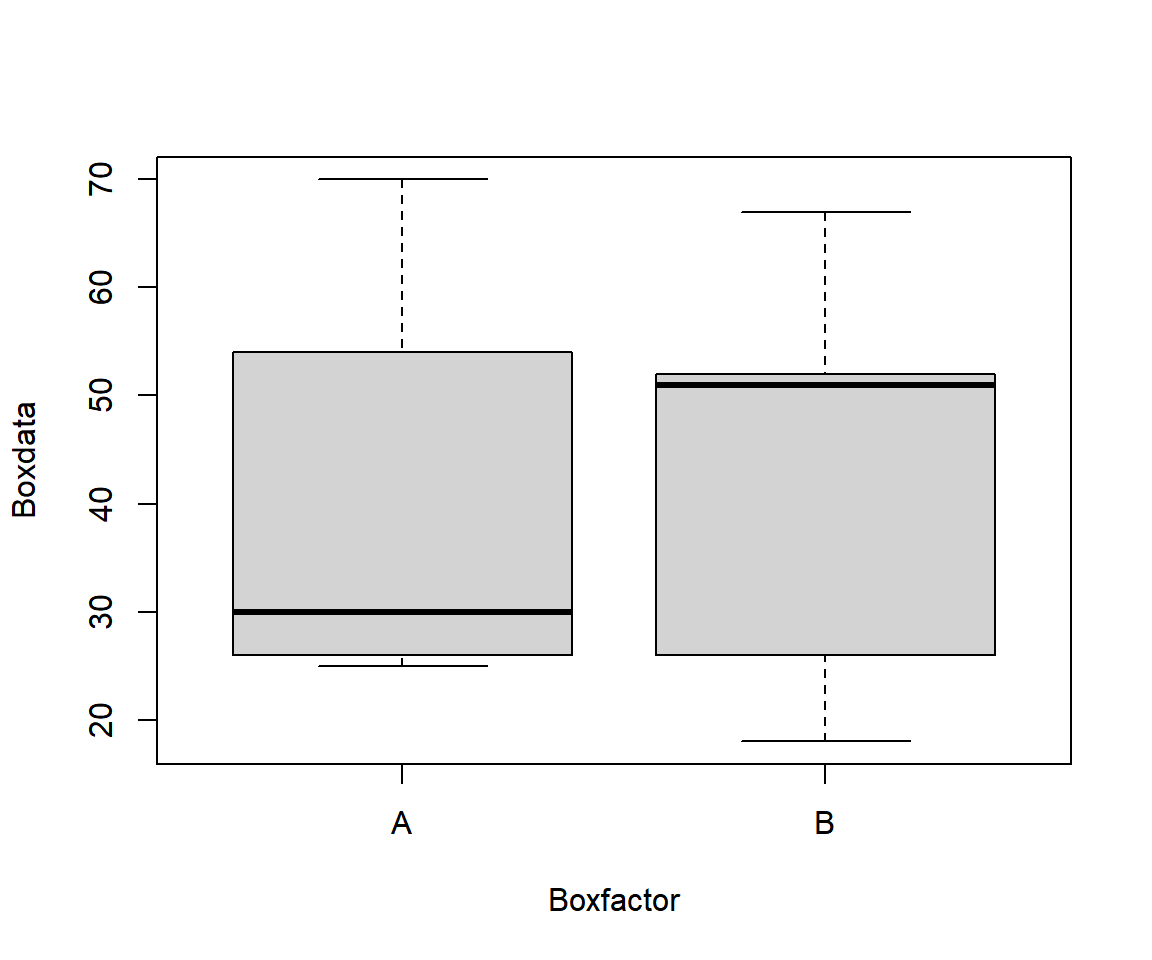
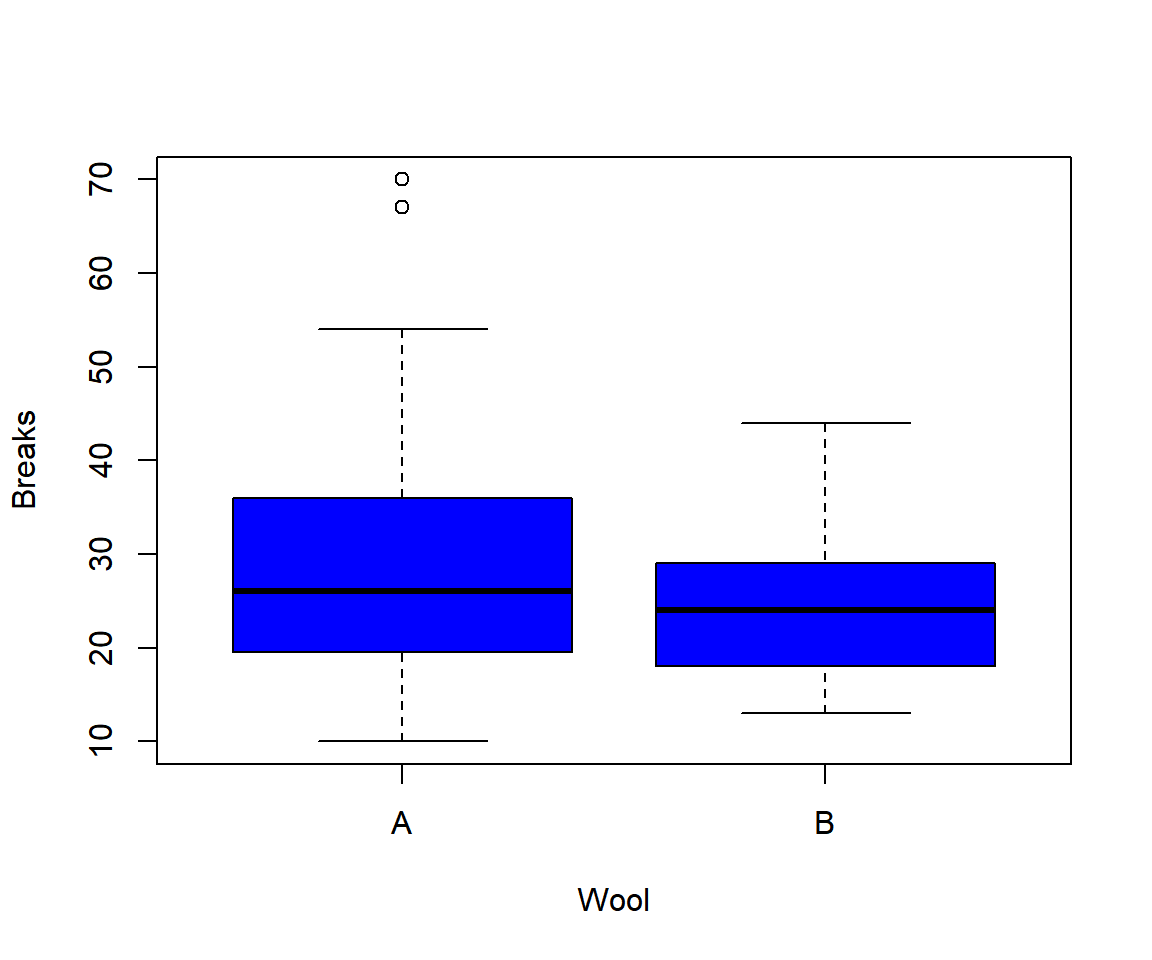
Example 1: Side-by-side Box Plot by Group in R
Using a Data Object:
Using the warpbreaks data from the "datasets" package with some sub-setting and filtering.
Example 2: Side-by-side Box Plot by Group in R
Or:
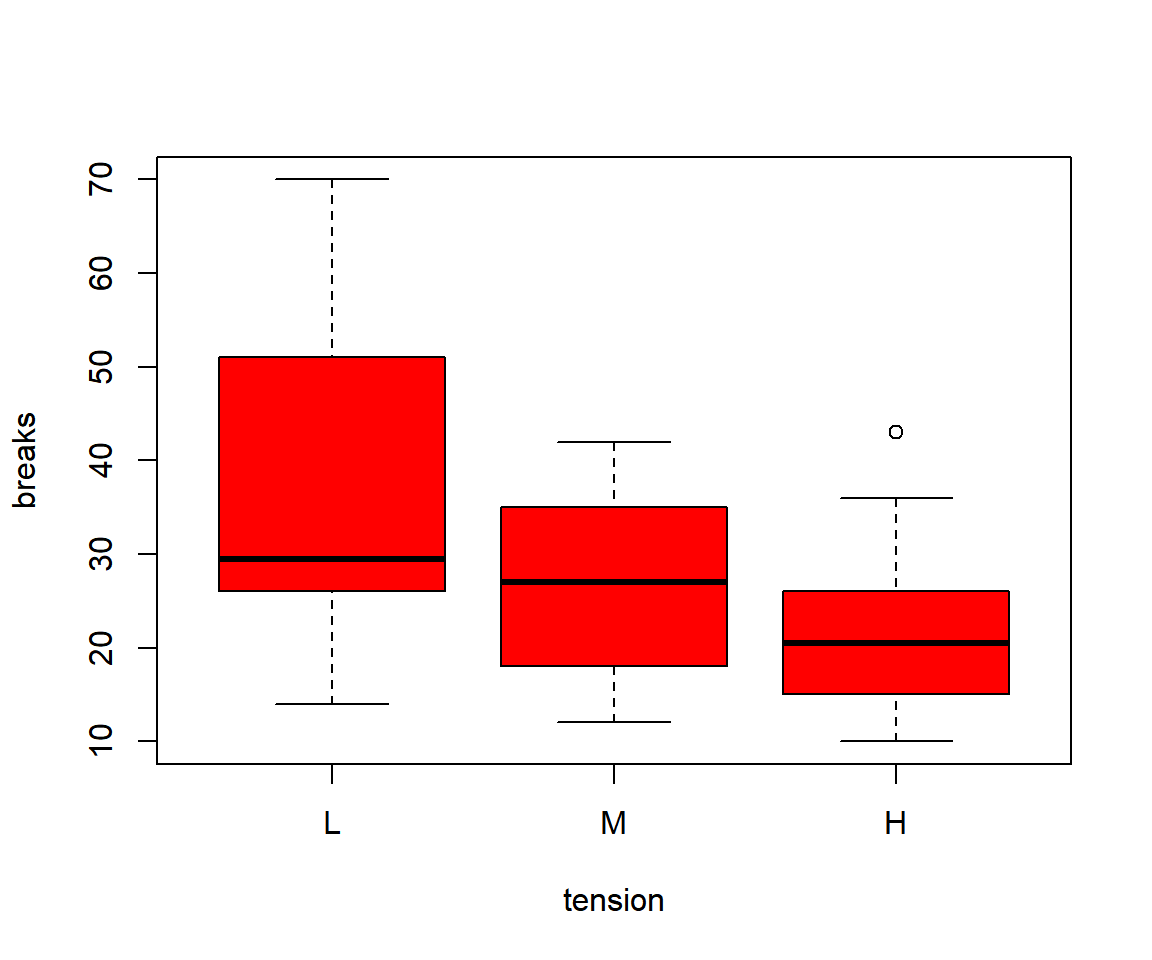
Example 3: Box Plot by a Factor in R
3 Create Horizontal Box Plot in R
To make horizontal box plot, set the "horizontal" argument to
TRUE.
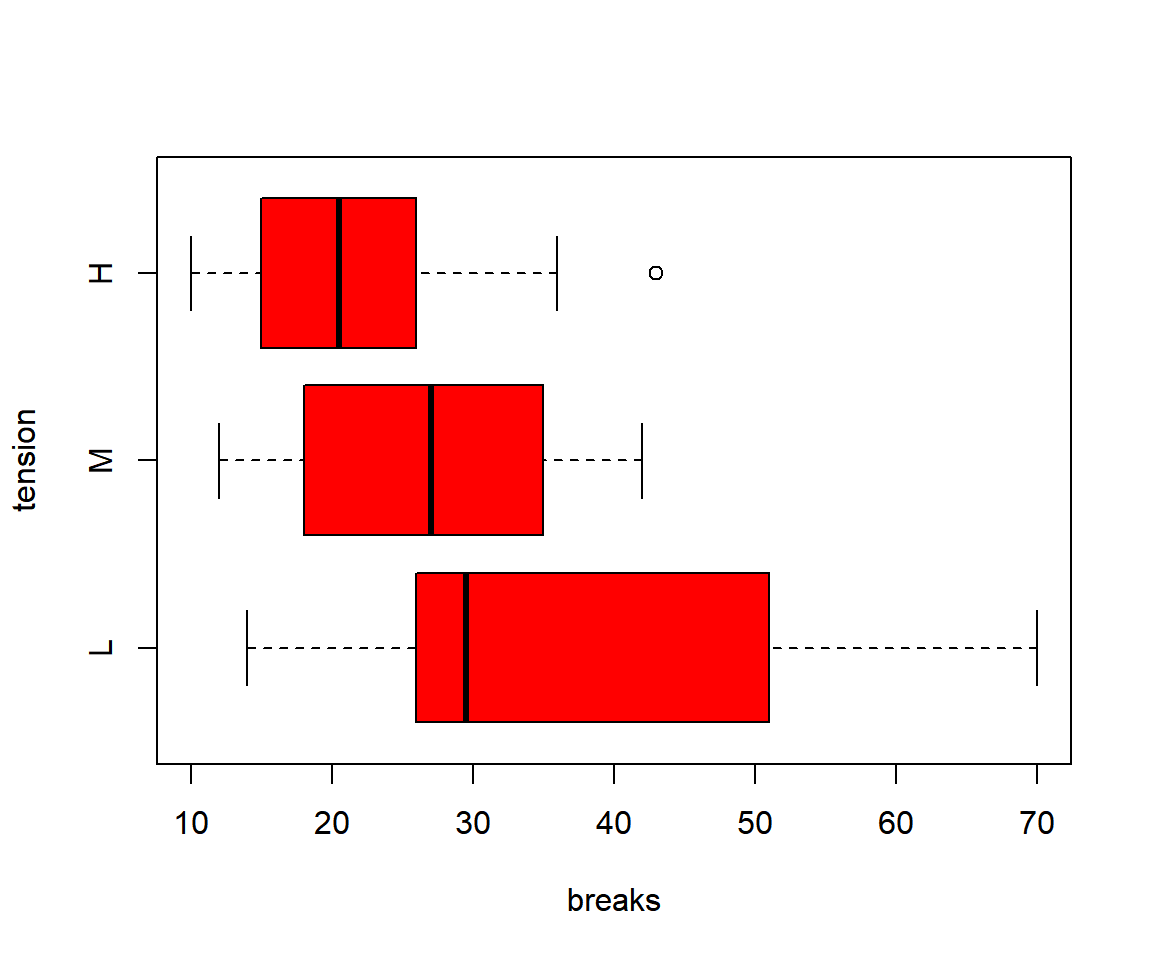
Horizontal Box Plot in R
4 Set Title, Labels, Limits, Colors, Fonts, Box Widths of a Box Plot in R
Here we set details such as title (main), x-axis and y-axis labels (xlab, ylab), limits (ylim), colors (col, border), and font sizes (cex), box widths (boxwex). See also setting colors and fonts for more details.
boxplot(breaks ~ tension, data = warpbreaks,
        main = "Warp Breaks Per Loom",
        xlab = "Tension",
        ylab = "Breaks",
        ylim = c(0, 80),
        col = c("purple", "violet", "orangered"),
        col.main="cyan", col.lab="blue", col.axis="red",
        border = "red",
        cex.main=1.5, cex.lab=1.2, cex.axis=1,
        boxwex = 0.75)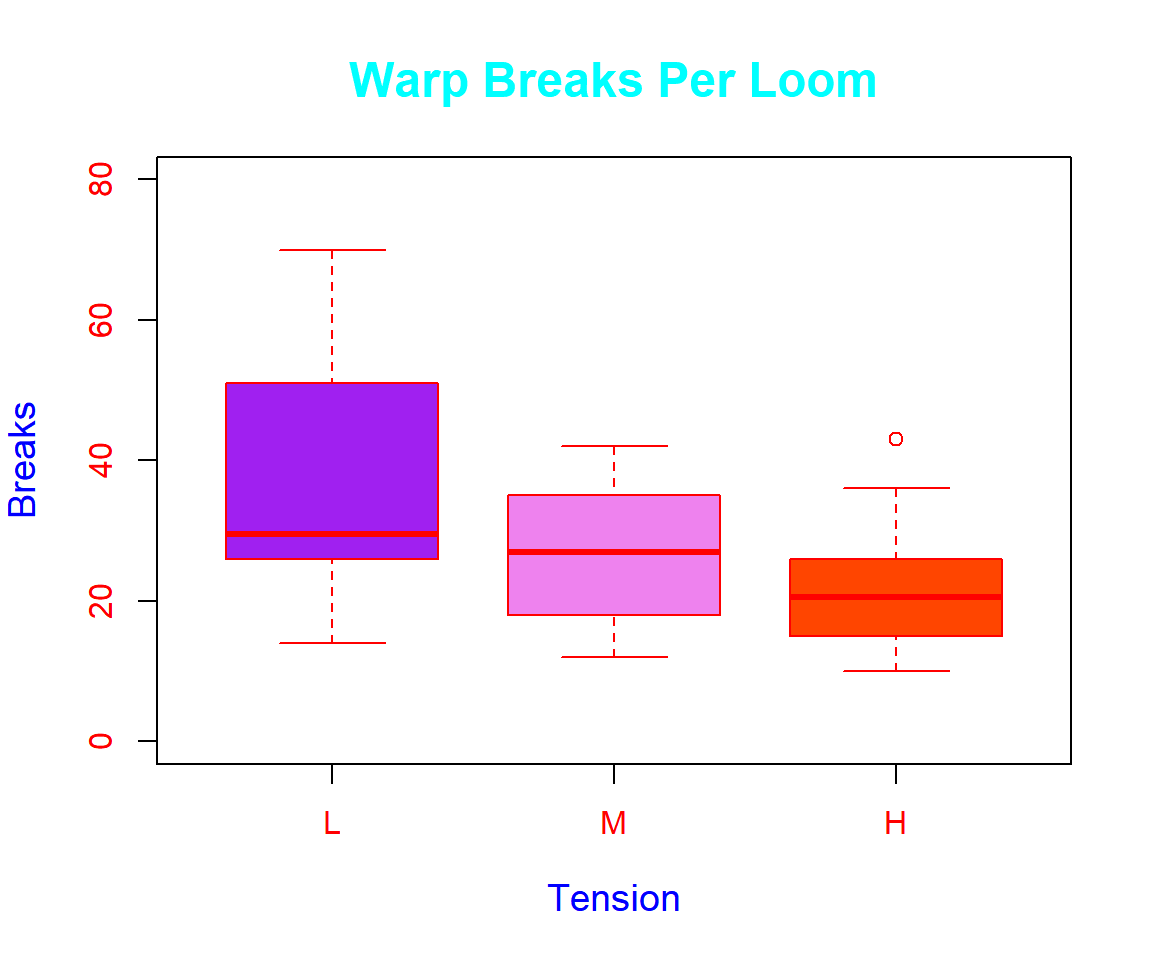
Side-by-side Box Plot with Title, Labels, Limits, Colors, Fonts, Box Widths Set in R
5 Create Two Variables Box Plot in R
To make a two-factor box plot, specify the interaction of the two
factors. A legend is added with
the legend() function, starting at \(x=5.5\) (i.e., between the 5th and 6th
boxes), and \(y = 75\).
boxplot(breaks ~ tension:wool, data = warpbreaks,
        main = "Warp Breaks",
        xlab = "Tension:Wool Interaction",
        ylab = "Breaks",
        ylim = c(0, 80),
        col = c("green", "pink", "gold"),
        sep = ":")

# Add legend
legend(5.5, 75, c("L", "M", "H"),
       fill = c("green", "pink", "gold"))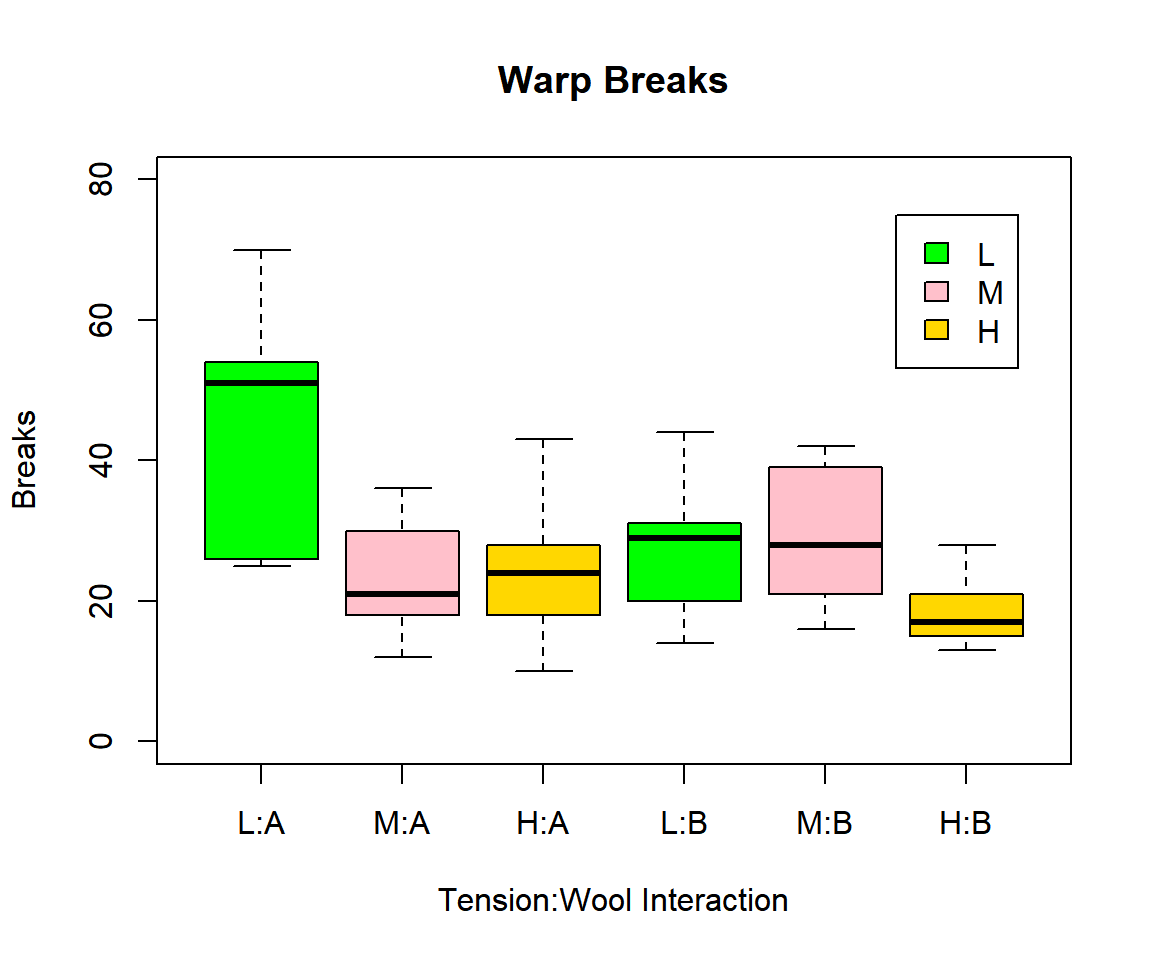
Two Variables Box Plot in R
6 Multiple Box Plots in One Plot in R
To have multiple box
plots in one plot, use the par() function. The first
argument is the number of rows, while the second is the number of
columns. You can add details to each bar plot as in the examples
above.
For example, for 1 row and 3 columns use:
par(mfrow=c(1, 3))
boxplot(warpbreaks$breaks, col = "red")
boxplot(breaks ~ wool, data = warpbreaks, col = "green")
boxplot(breaks ~ tension, data = warpbreaks, col = "blue")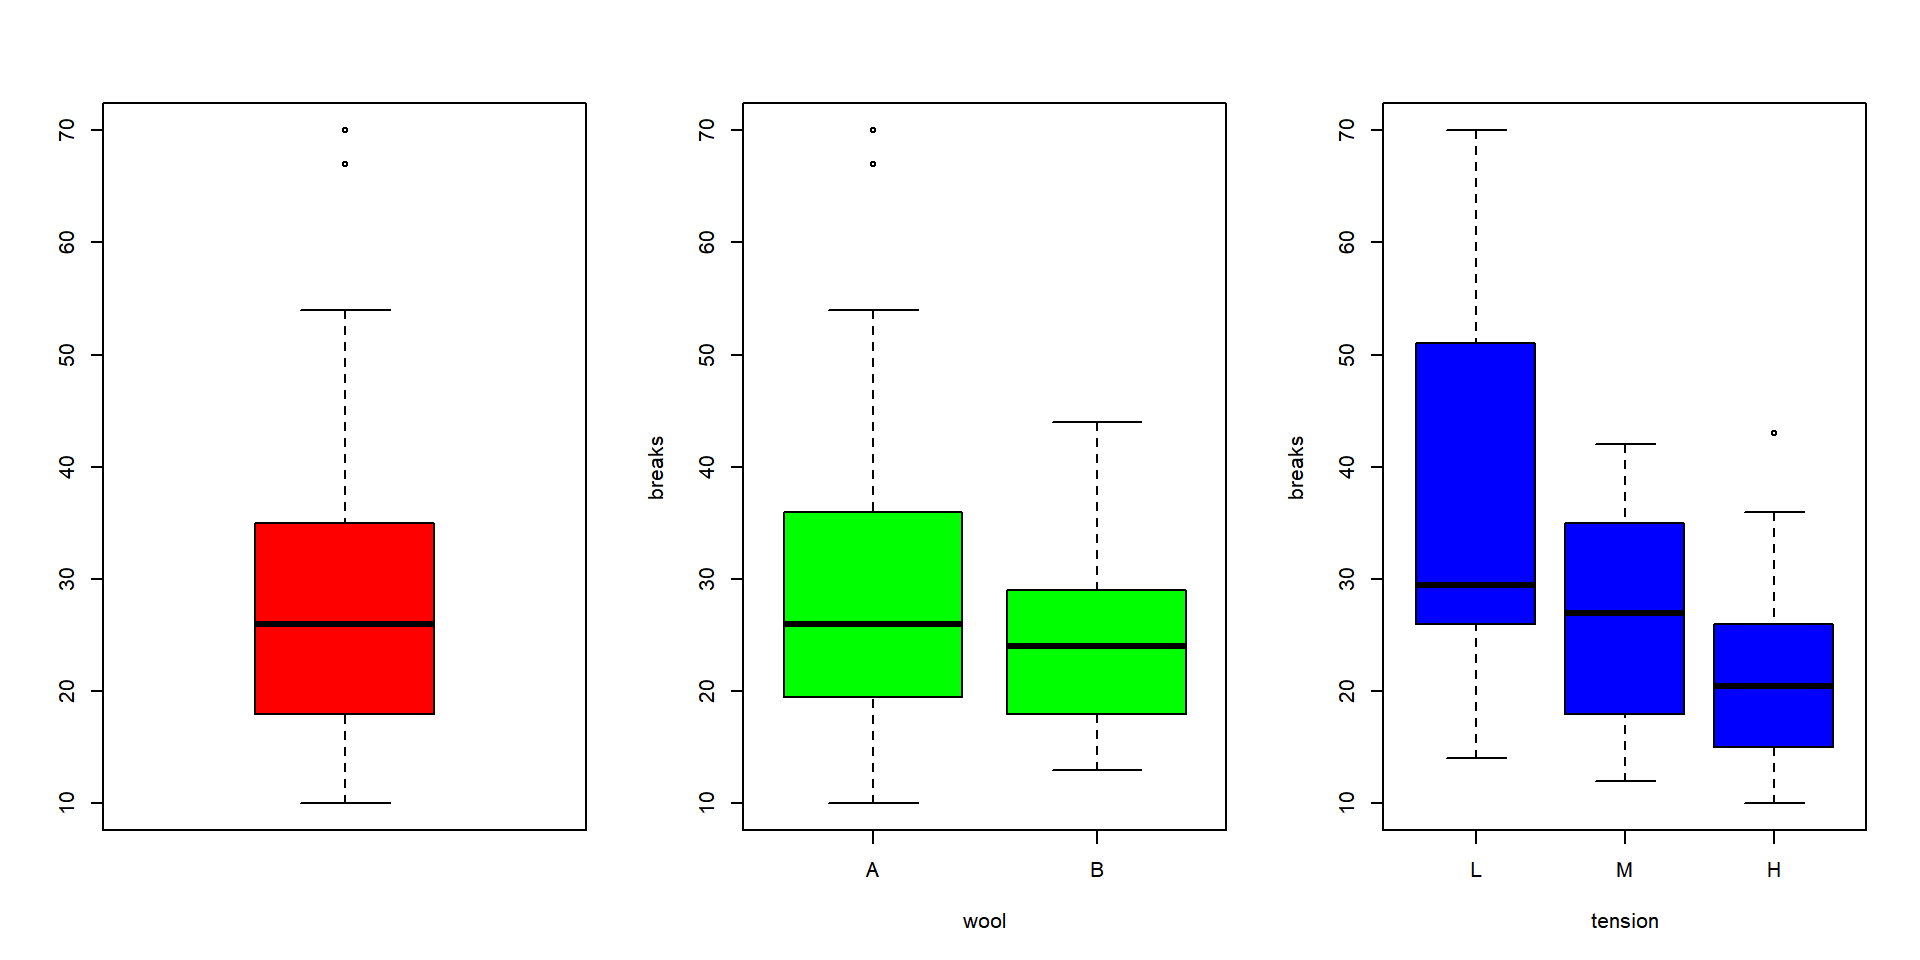
Multiple Box Plots in One Plot in R
The feedback form is a Google form but it does not collect any personal information.
Please click on the link below to go to the Google form.
Thank You!
Go to Feedback Form
Copyright © 2020 - 2026. All Rights Reserved by Stats Codes