Scaling and Setting Limits of Plot Axis in R
Here we show how to scale a plot’s axis, including log scale, and set axis limits in R.
See also plots and charts.
| Argument | Usage |
| log = "x" | Log scale of the x-axis |
| log = "y" | Log scale of the y-axis |
| log = "xy" | Log scale of both axis |
| xlim = c(a, b) | Setting x-axis limits from a to b |
| ylim = c(a, b) | Setting y-axis limits from a to b |
1 Scaling of Plot Axis to Log Scale in R
The following examples show the scaling of both the x-axis and the y-axis.
x = (1:20)*100
y = (1:20)*100

par(mfrow = c(2,2))

# Normal Scales
plot(x, y, main = "Normal Scale",
     xlab = "X", ylab = "Y")

# X-axis to log scale
plot(x, y, main = "X-axis to Log Scale",
     log = "x",
     xlab = "Log X", ylab = "Y")

# Y-axis to log scale
plot(x, y, main = "Y-axis to Log Scale",
     log = "y",
     xlab = "X", ylab = "Log Y")

# X-axis and Y-axis to log scale
plot(x, y, main = "X-axis and Y-axis to Log Scale",
     log = "xy",
     xlab = "Log X", ylab = "Log Y")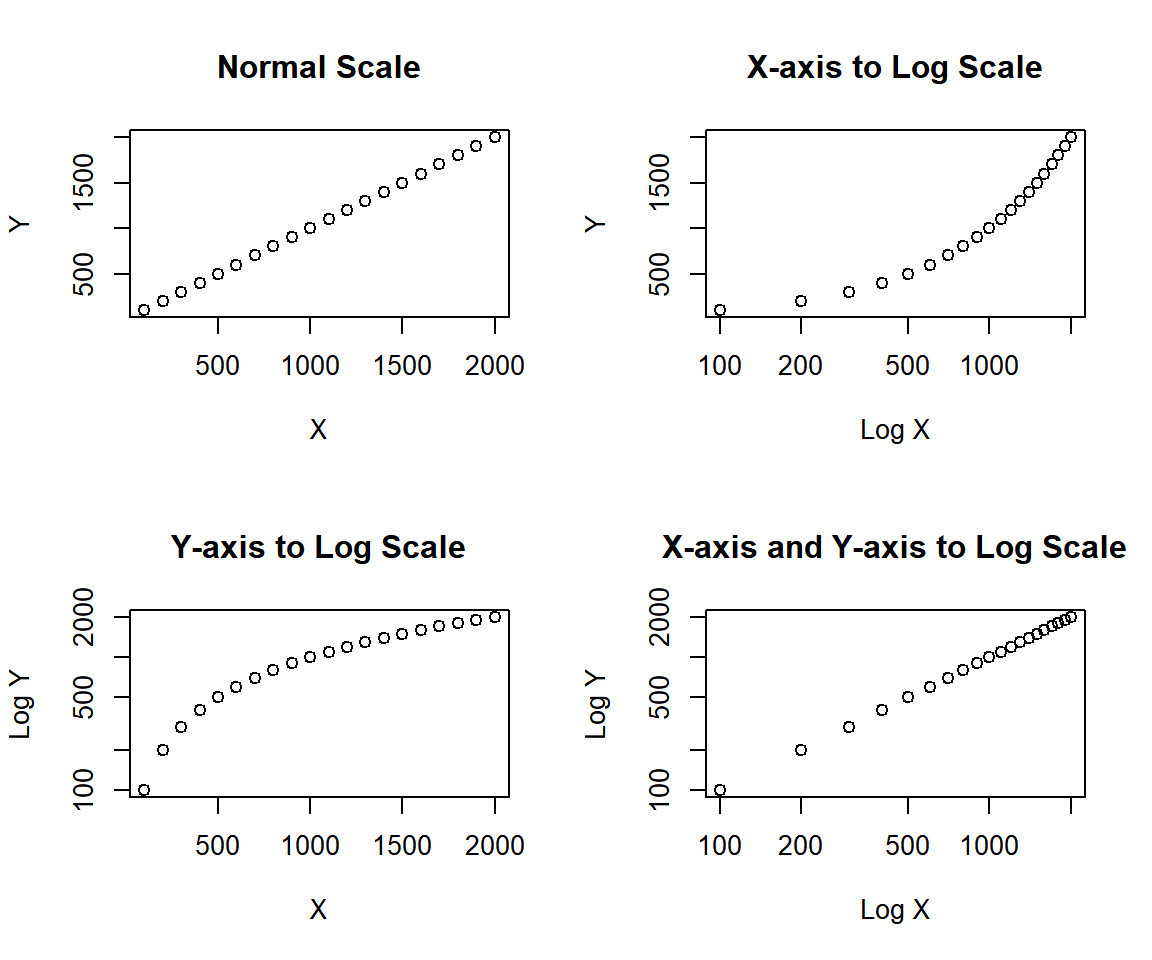
Scaling of Plot Axis to Log Scale in R
2 Setting Axis Limits in R
The following examples show the setting of limits of both the x-axis and the y-axis.
Histdata = rnorm(1000)

par(mfrow = c(2,2))

# Plot 1
hist(Histdata, main = "Plot 1")

# Plot 2
hist(Histdata, main = "Plot 2",
     xlim = c(-4, 4),
     ylim = c(0, 300))

# Plot 3
hist(Histdata, main = "Plot 3",
     xlim = c(-2, 2),
     ylim = c(0, 400))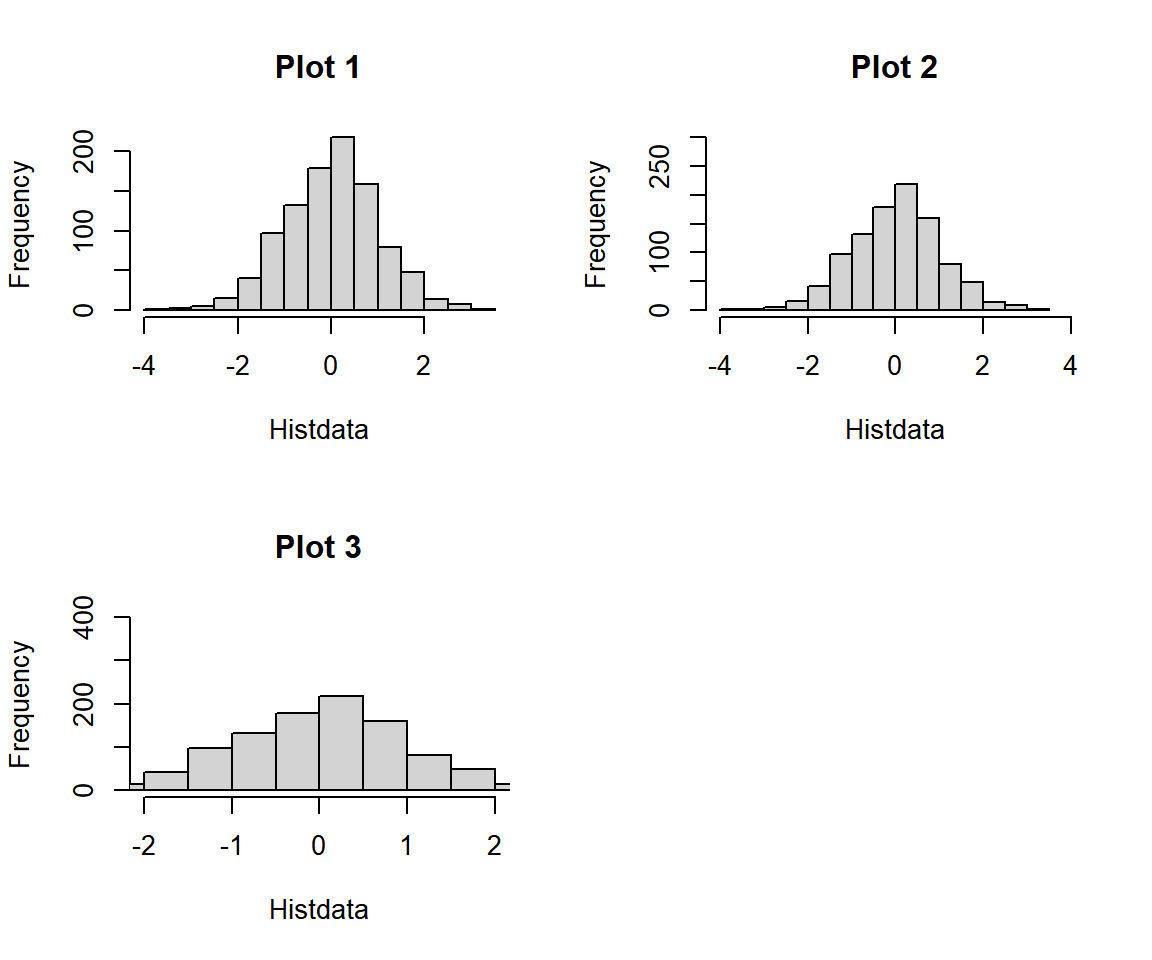
Setting Axis Limits in R
The feedback form is a Google form but it does not collect any personal information.
Please click on the link below to go to the Google form.
Thank You!
Go to Feedback Form
Copyright © 2020 - 2026. All Rights Reserved by Stats Codes