Dot Plots in R
Here, we show how to make dot plots and stacked dot plots in R, and set title, labels, colors, fonts and offsets.
These are done with the dotchart() and
stripchart() functions.
See plots & charts and point types & sizes for graphical parameters and other plots and charts.
1 Create a Simple Dot Plot in R
Enter the data by hand:
Food = c(22.2, 44.5, 59.6, 73.2, 86.8)
Household = c(10.5, 15.5, 29.0, 36.5, 46.2)
Medical = c(3.53, 5.76, 9.71, 14.0, 21.1)

Expense = as.matrix(cbind(Food, Household, Medical))
rownames(Expense) = c("1940", "1945", "1950", "1955", "1960")
colnames(Expense) = c("Food", "Household", "Medical")

Expense
Food Household Medical
1940 22.2 10.5 3.53
1945 44.5 15.5 5.76
1950 59.6 29.0 9.71
1955 73.2 36.5 14.00
1960 86.8 46.2 21.10You can then create a simple dot plot with the
dotchart() function:
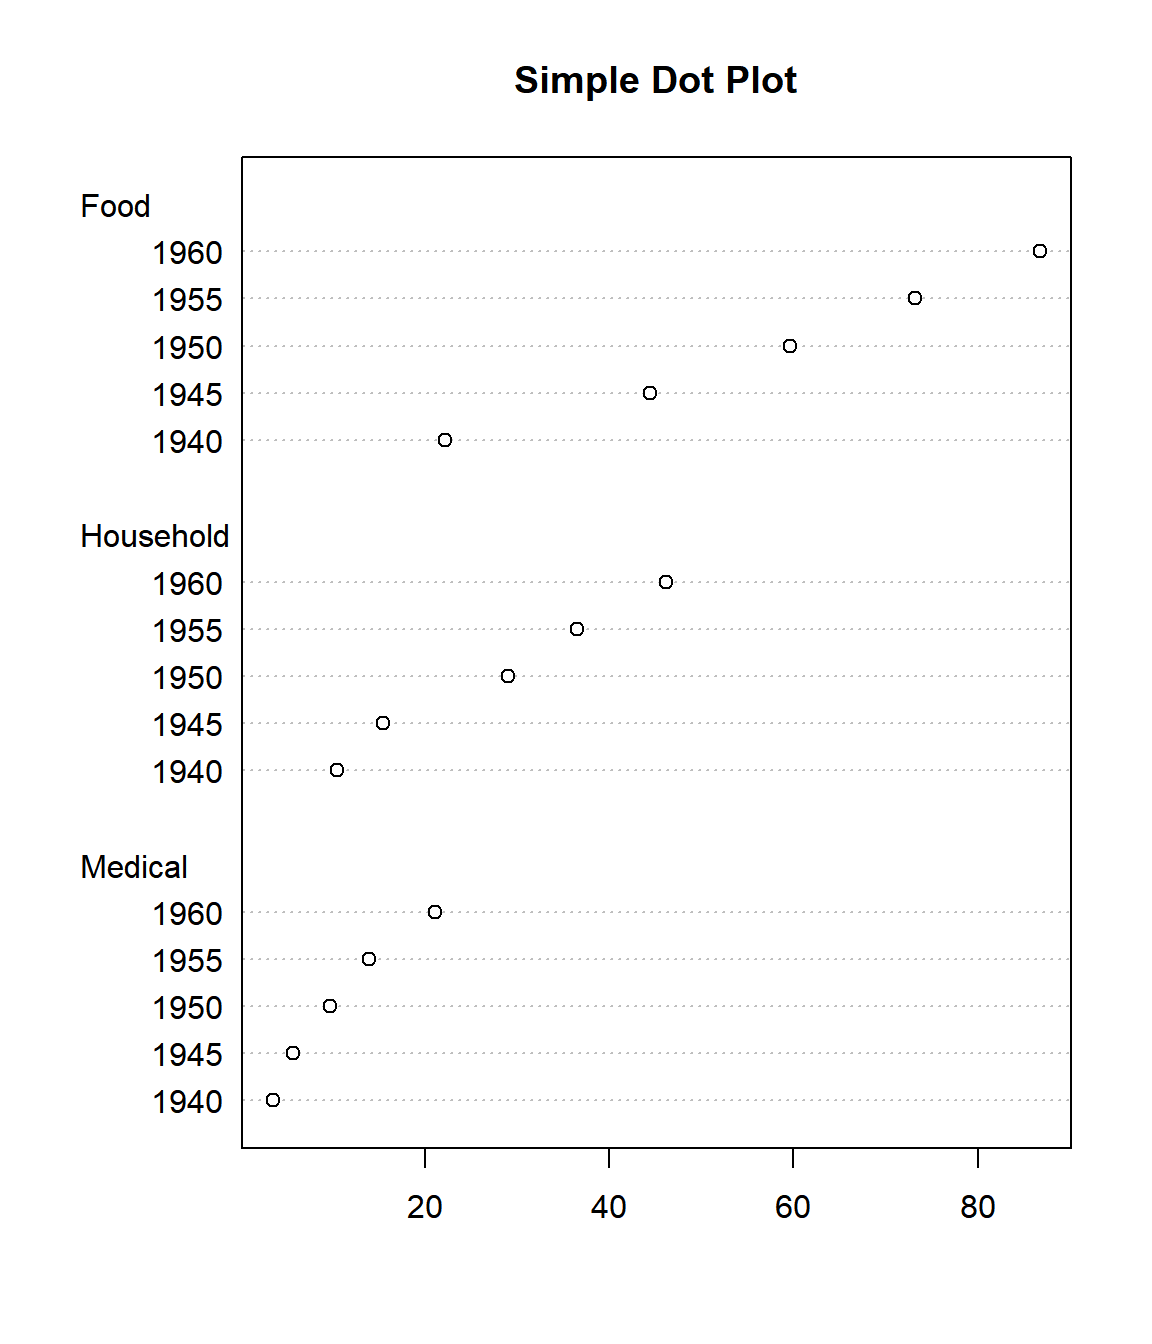
Example 1: Simple Dot Plot in R
Or transpose the data with the t() function to
change the factor hierarchy:
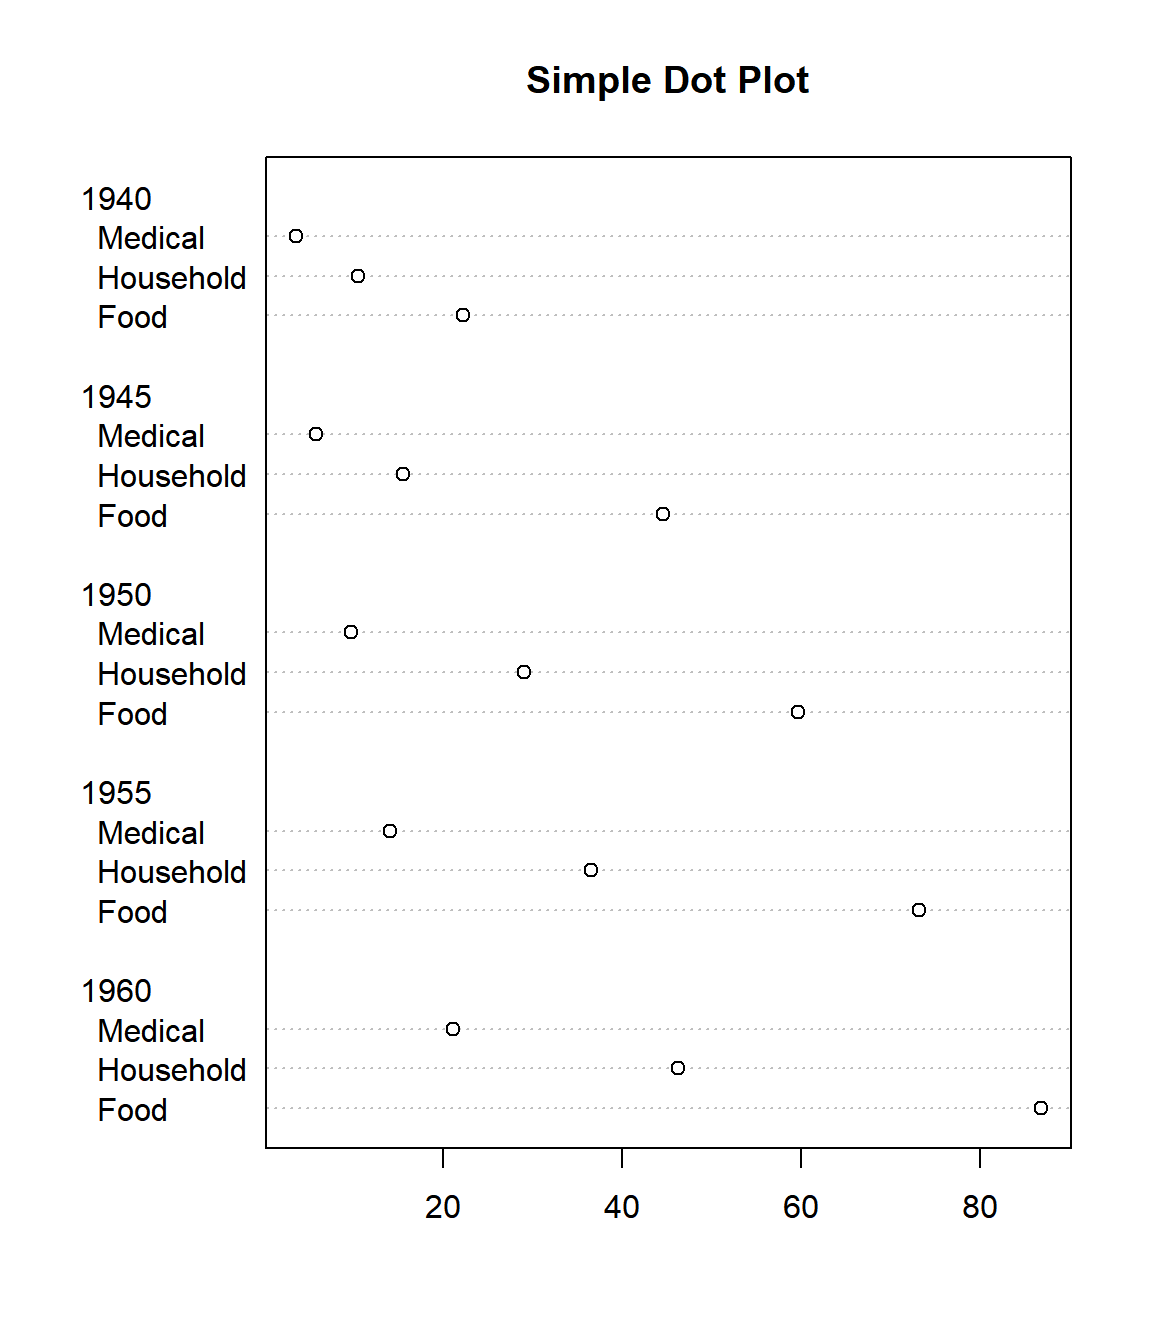
Example 2: Simple Dot Plot in R
2 Set Title, Labels, Colors, Dot Type, and Fonts of a Dot Plot in R
Here we set details such as title (main), x-axis and y-axis labels (xlab, ylab), colors (col), dot type (pch), font types (font), and font sizes (cex). See also setting colors and fonts for more details.
See Expense data above.
dotchart(Expense,
         main = "Dot Plot of Expense",
         xlab = "Amount (in billions of Dollars)",
         ylab = "Year by Sector",
         col = "purple",
         col.main="blue", col.lab="green",
         pch = 12,
         font=1, font.lab=4, font.main=2,
         cex.main=1.5, cex.lab=1.2, cex=1)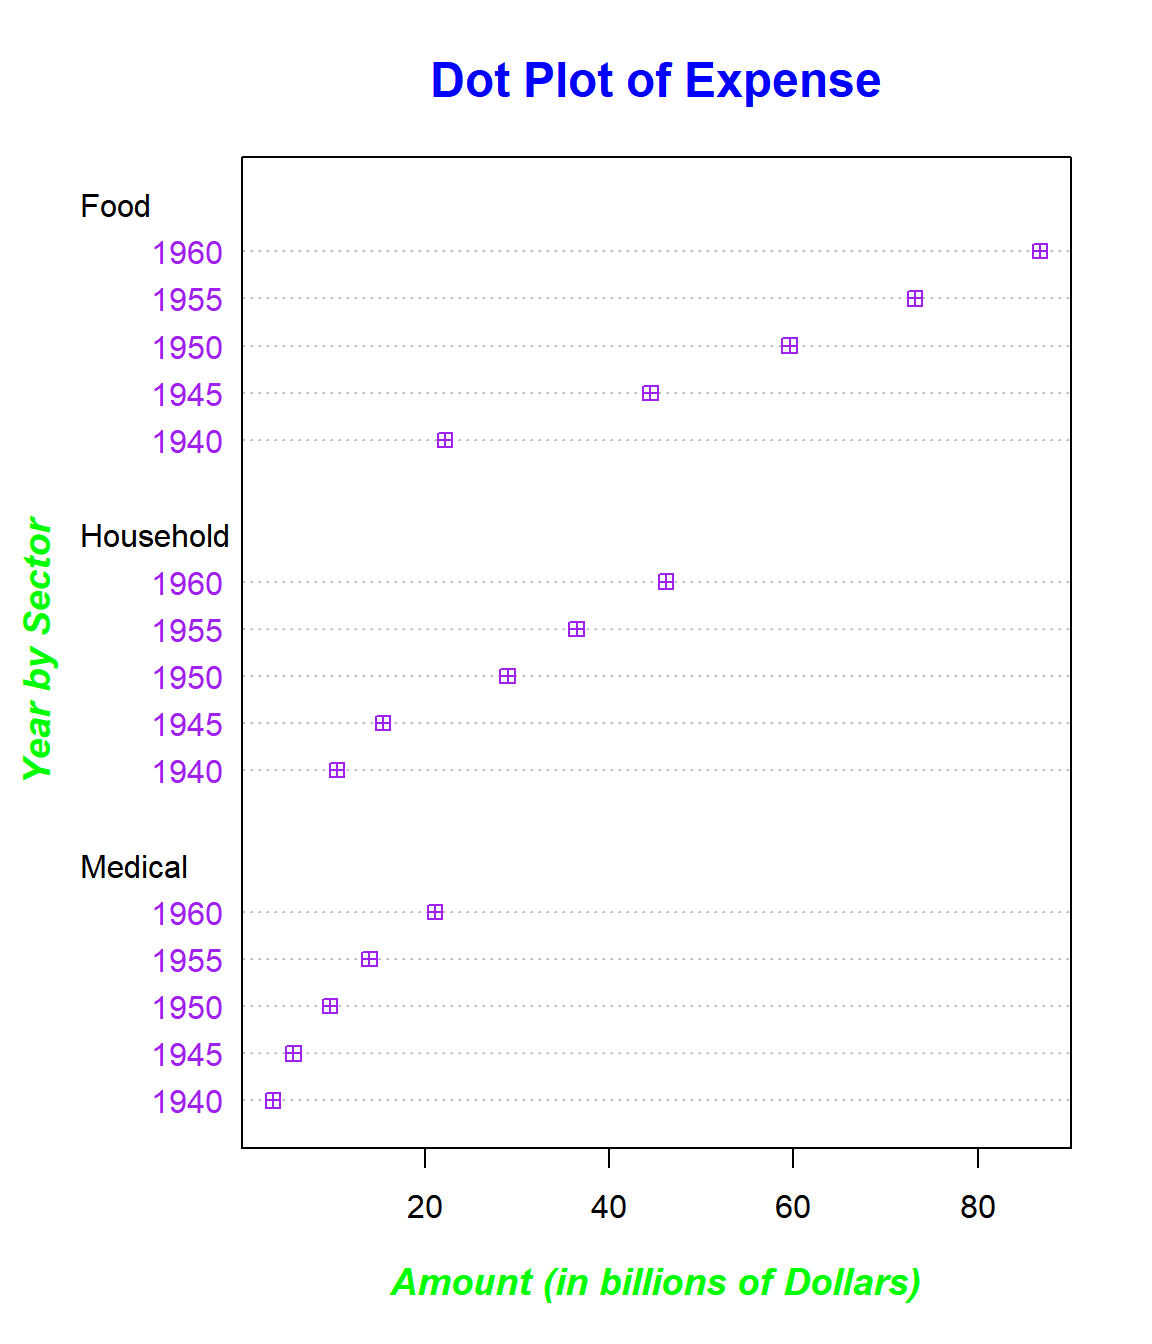
Dot Plot with Title, Labels, Colors, Dot Type, Fonts Set in R
3 Create a Stacked Dot Plot in R
Enter the data by hand:
Dotdata = c(31, 30, 34, 25, 30, 32, 26, 31, 27, 28,
            32, 29, 31, 27, 28, 25, 31, 32, 31, 26,
            26, 35, 34, 25, 32, 27, 31, 26, 32, 33,
            27, 34, 27, 32, 28, 30, 25, 26, 33, 26)
You can then create a stacked dot plot with the
stripchart() function:
The "method" argument is set to "stack". The second plot has the argument "offset = 1" to add spaces between the dots, and the argument "at = 0" to shift the dots downwards.
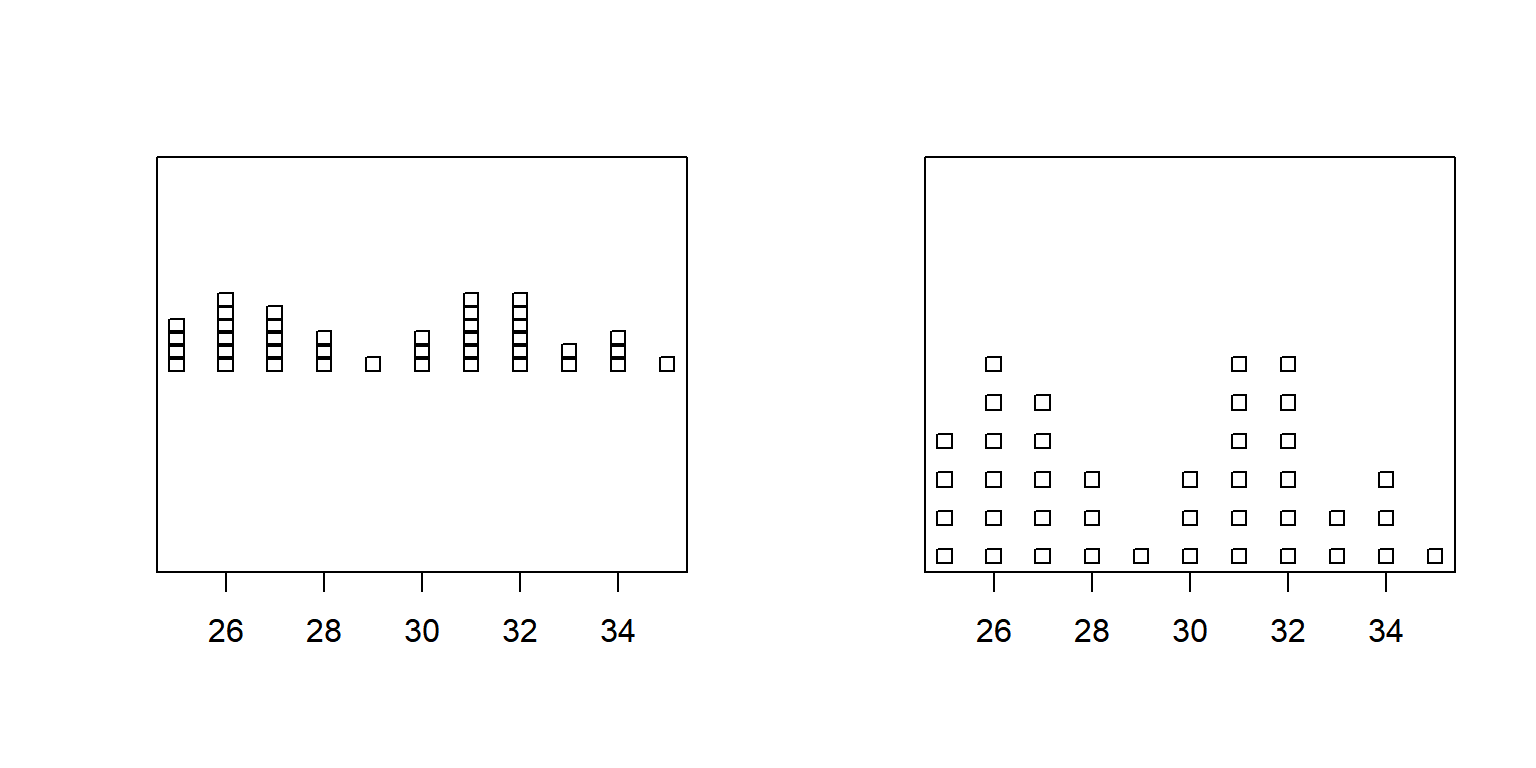
Example 1: Stacked Dot Plot in R
Using a Data Object:
Using the InsectSprays data from the "datasets" package with some sub-setting and filtering.
Sample rows from the InsectSprays data:
   count spray
1     10     A
15    21     B
32     1     C
43     5     D
44     5     D
51     3     E
52     5     E
55     1     E
68    10     F
72 13 FOr:
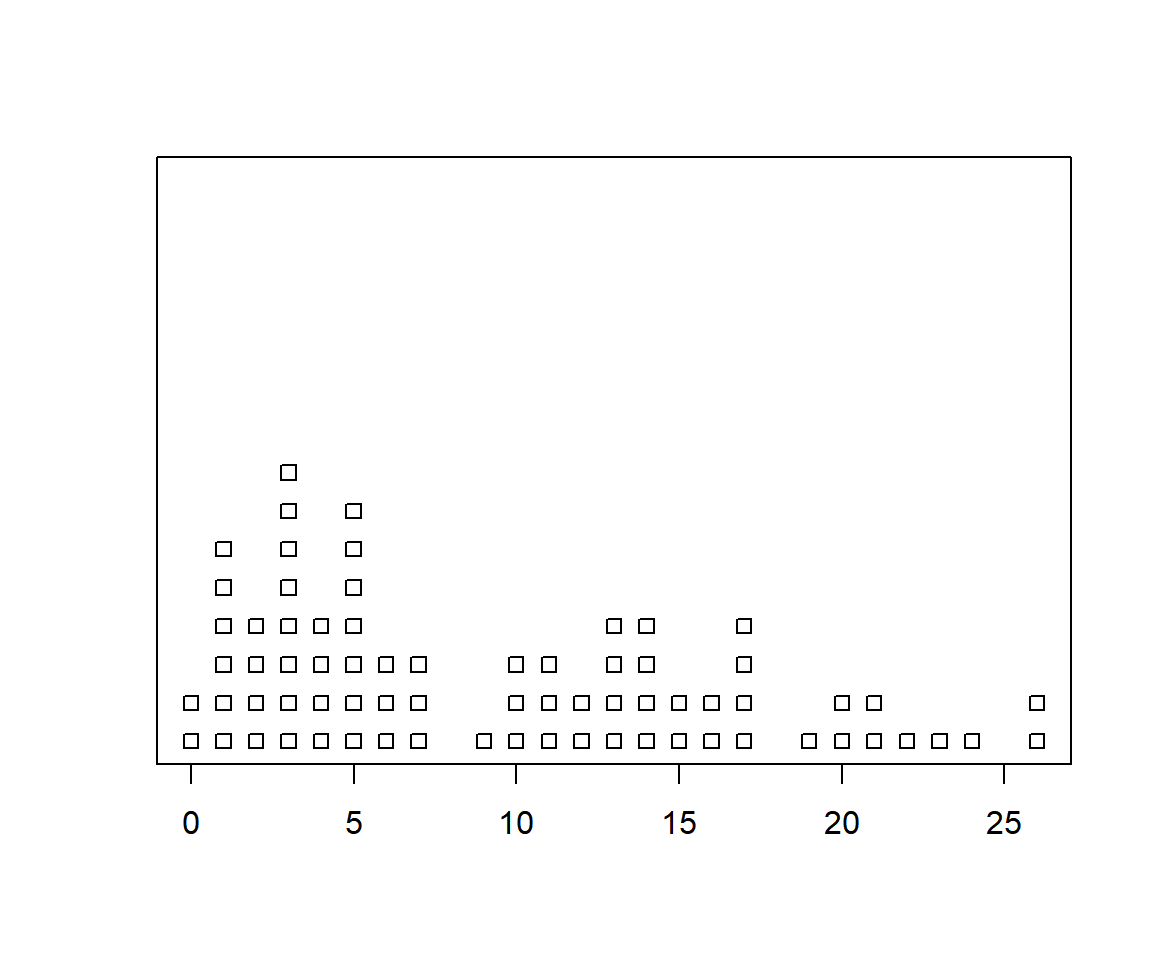
Example 2: Stacked Dot Plot in R
4 Set Title, Labels, Colors, Dot Type, Fonts, and Offset of a Stacked Dot Plot in R
Similarly, to the example above, we set details.
stripchart(InsectSprays$count, method = "stack", offset=1, at = 0,
           main = "Dot Plot of Insect Sprays",
           xlab = "Count of Insects",
           ylab = "Frequency",
           col = "purple",
           col.main="blue", col.lab="green",
           pch = 19,
           font=1, font.lab=3, font.main=2,
           cex.main=1.65, cex.lab=1.2, cex=1)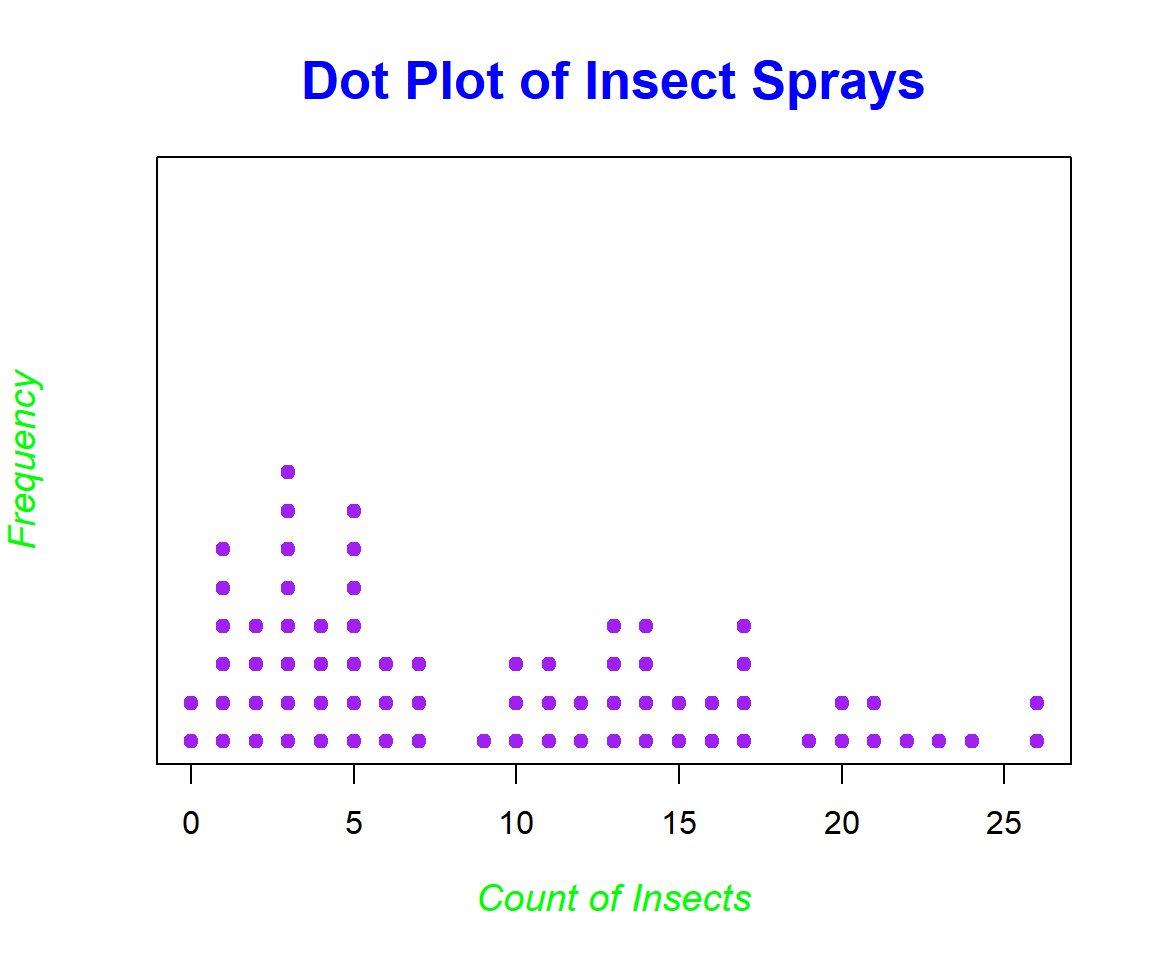
Stacked Dot Plot with Title, Labels, Colors, Dot Type, Fonts, Offset Set in R
5 Stacked Dot Plot by Variable or Group in R
You can create a stacked dot plot by a variable by specifying the variable of interest. You can also add details to the dot plot as in the examples above.
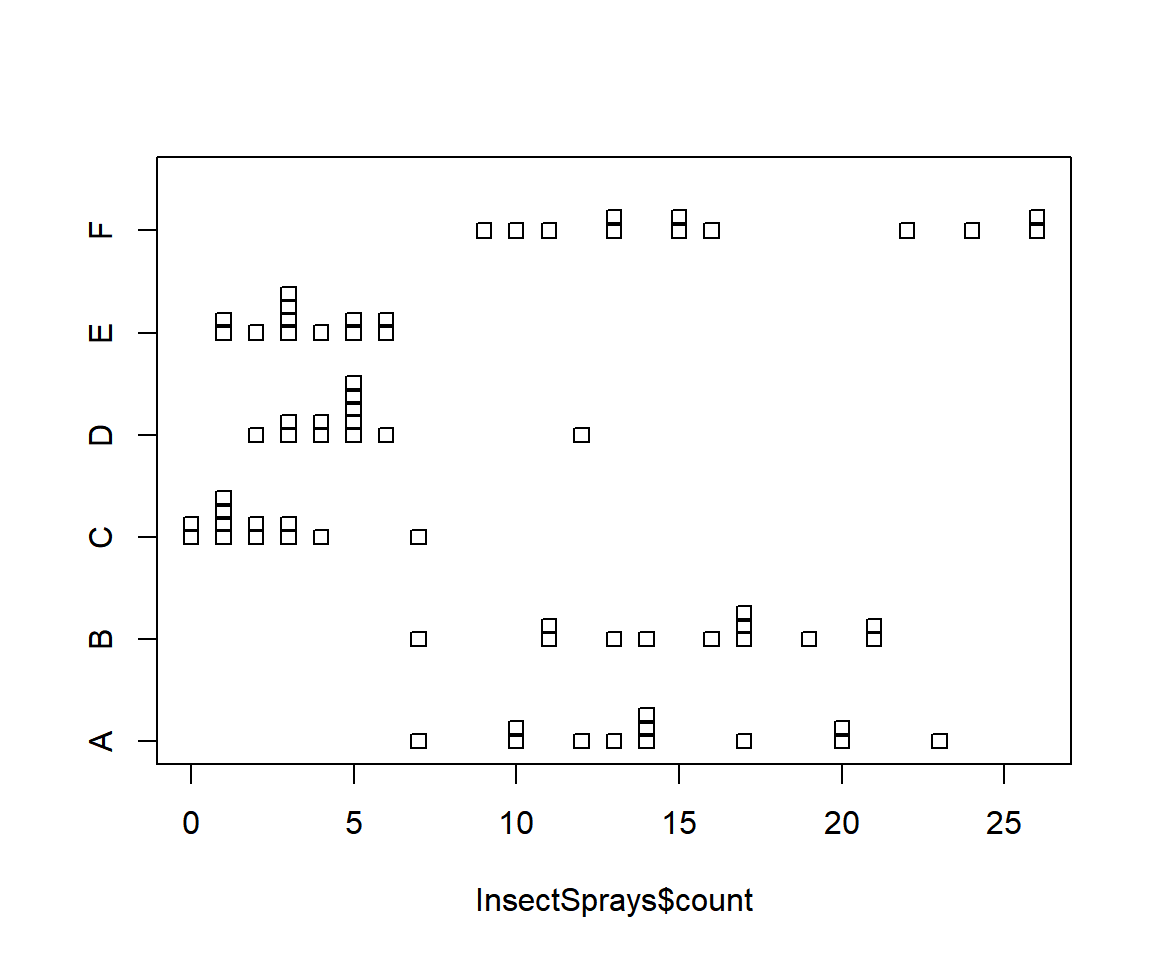
Stacked Dot Plot by Factor in R
The feedback form is a Google form but it does not collect any personal information.
Please click on the link below to go to the Google form.
Thank You!
Go to Feedback Form
Copyright © 2020 - 2026. All Rights Reserved by Stats Codes