Point Types and Point Sizes in R
Here we introduce point types and sizes in R. How to set point types, change the point sizes and set point colors.
See also scatter plots and dot plots.
| Argument | Usage |
| pch | Setting point types |
| cex or pt.cex | Setting point sizes |
| col | Set point colors |
1 Point Types in R
In this section we show the main point types in R for use in plots like scatter plots and dot plots.
This is set with the argument "pch", for example, pch = 1 or pch = "$".

Plot Point Types in R
See examples below.
2 Point Sizes in R
In this section we show to set point sizes in R for use in plots like scatter plots and dot plots.
This is set with the argument "cex" or "pt.cex" depending on the plot type, for example, cex = 1 or cex = 3.
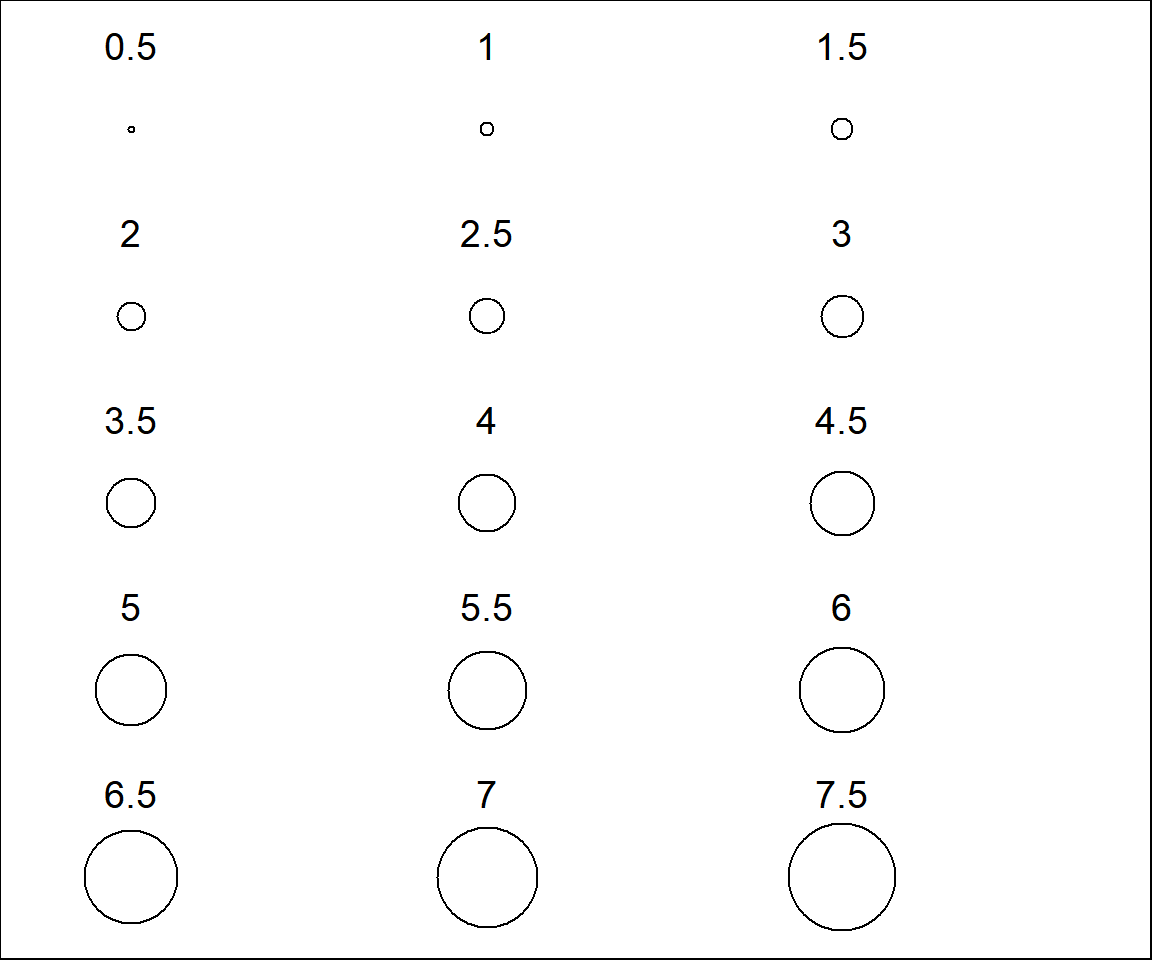
Plot Point Sizes in R
See examples below.
3 Examples: Setting Point Types and Sizes in R
Here, we show some examples setting the point types and sizes as shown above.
Example using a scatter plot:
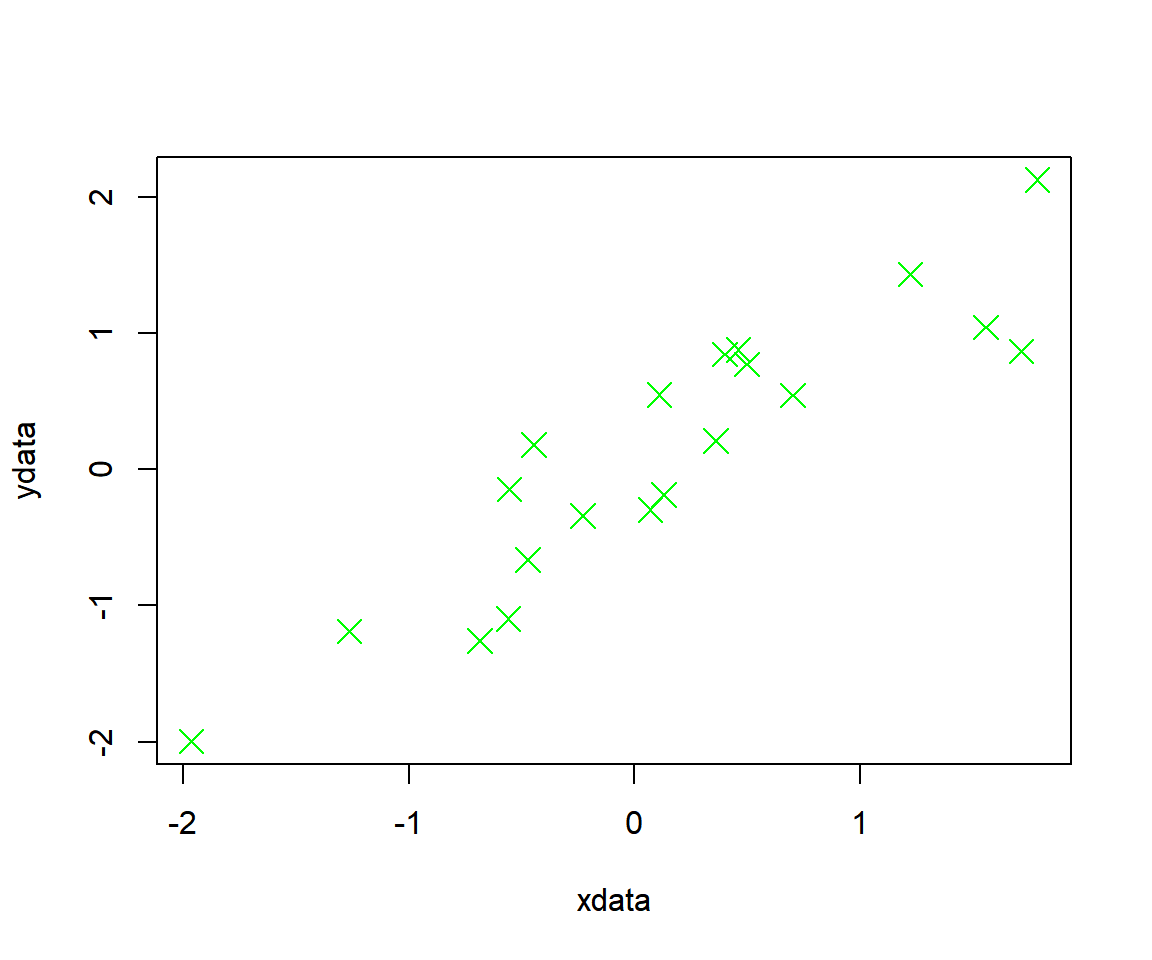
Point Types and Sizes in R - Scatter Plot
Example using a dot plot:
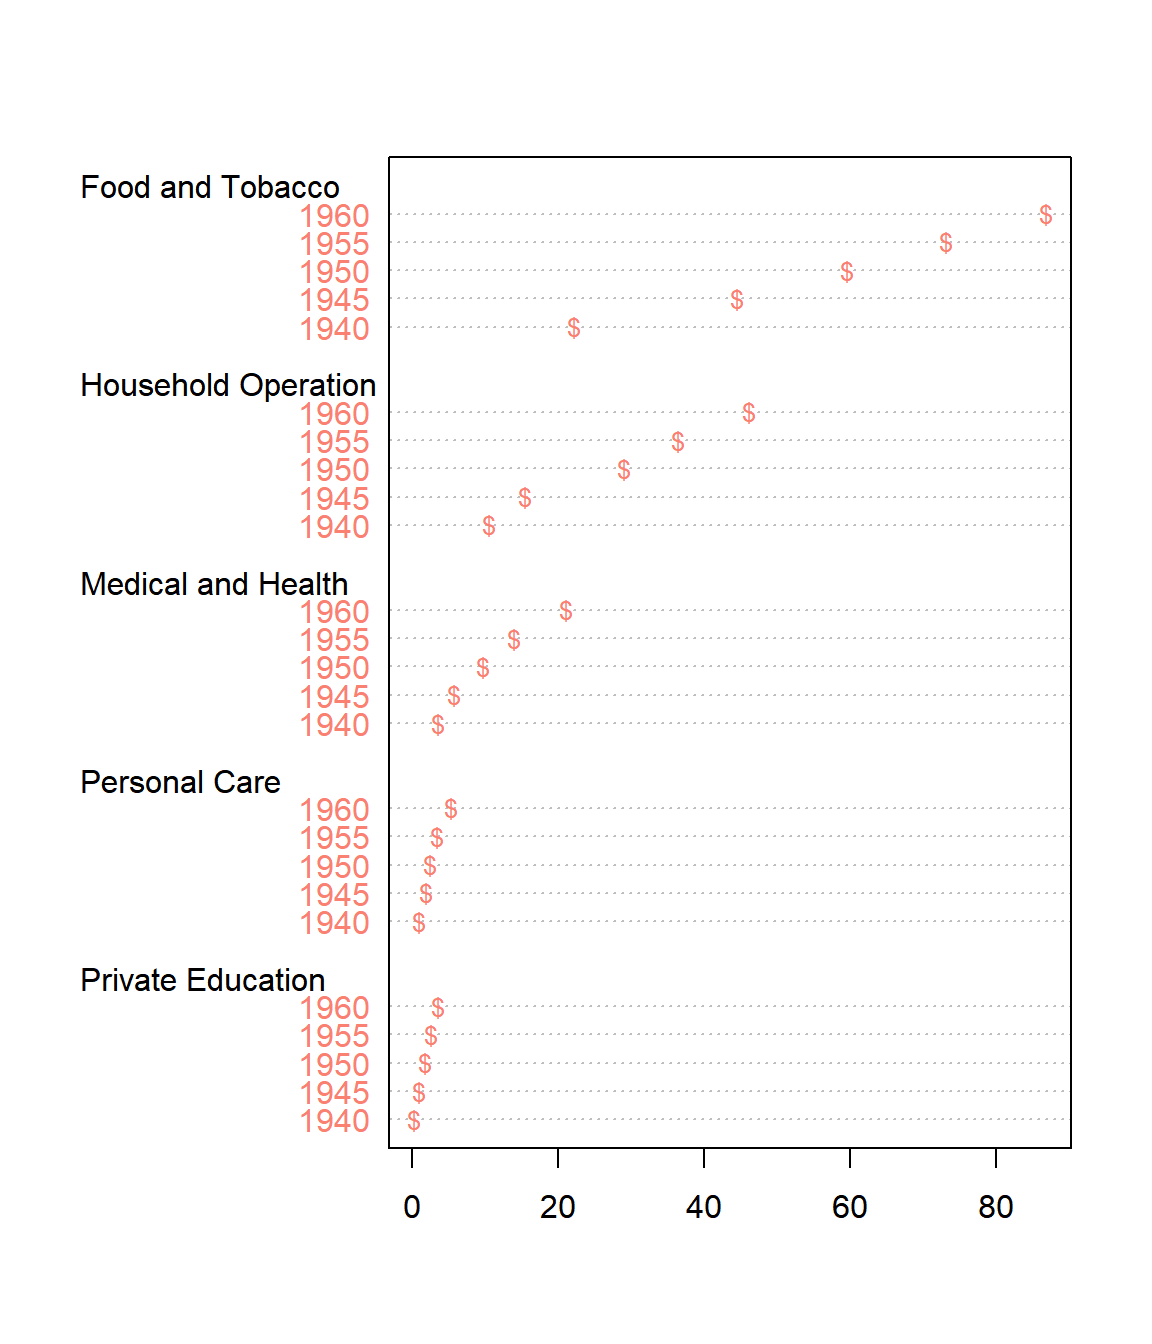
Point Types and Sizes in R - Dot Plot
The feedback form is a Google form but it does not collect any personal information.
Please click on the link below to go to the Google form.
Thank You!
Go to Feedback Form
Copyright © 2020 - 2026. All Rights Reserved by Stats Codes