Texts, Counts, and Windows Style Fonts on Plots & Margins in R
Here we show how to add texts, counts, and Windows style fonts on plots & margins in R, including Arial, Comic Sans MS, Calibri, and Cambria Math fonts.
These will be done using the text() and
mtext() functions from the "graphics" package.
See also mathematical expressions on plots.
| Argument | Usage |
| col | Set text color |
| cex | Set text font size |
| adj | Shift text from the center |
1 Add Texts on Plots & Charts in R
Here we show various texts on a plot including italic words, bold words, colored words, and big & small fonts words.
The first two arguments are the x and y co-ordinates where the text will be centered in the plot area. The argument "col" is used to set color, "font" for font type, "cex" for font size, and "adj" to shift the texts from the x-y co-ordinate center.
plot(12, 12, pch = "",
     xlim = c(0,12), ylim = c(0,10),
     xlab = "", ylab = "",
     main = "Texts on Plot & Charts")

# Text Codes
text(3, 10, "Blue Word", col = "blue")
text(5, 8, "Bold Italic Word", font = 4)
text(6, 6, "Italic Word", font = 3)
text(6, 6, "Shifted Italic Word", font = 3, adj = c(0.5, -0.8))
text(7, 4, "Bold Word", font = 2)
text(8, 2, "Big Red Word", col = "red", cex = 1.2)
text(9, 0, "Small Word", cex = 0.8)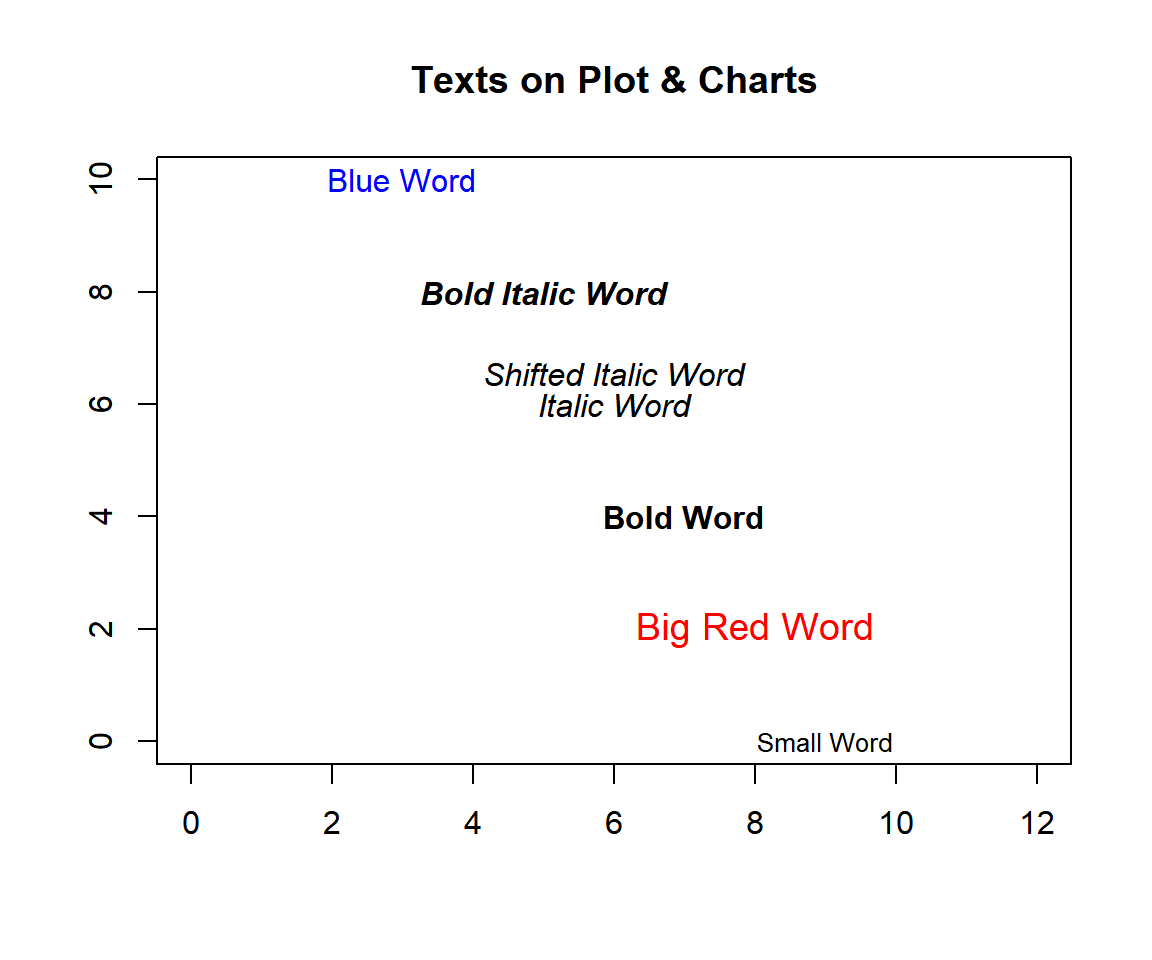
Texts on Plots & Charts in R
2 Add Windows Font Styles on Plots & Charts in R
Here we show examples of texts on plots with Windows font styles such as Times New Roman, Arial, Courier New, Comic Sans MS, Calibri, Arial Black, and Cambria Math.
The first two arguments are the x and y co-ordinates where the
Windows font style texts will be centered in the plot area. The argument
"family" is used to set the font style which is either a default style
or from the windowsFonts() function, this is then applied
in the text function.
plot(6, 6, pch = "",
     xlim = c(0,6), ylim = c(0,6),
     xlab = "", ylab = "",
     main = "Windows Font Styles on Plots & Charts")

# Text Codes for Default Fonts
text(3, 6, family="serif", "Text in Times New Roman")
text(3, 5, family="sans", "Text in Arial", col = "blue")
text(3, 4, family="mono", "Text in Courier New")

# Text Codes for More Fonts
windowsFonts(Comic = windowsFont("Comic Sans MS"))
text(3, 3, family = "Comic", "Text in Comic Sans", col = "green")
windowsFonts(Calibri = windowsFont("Calibri"))
text(3, 2, family = "Calibri", "Text in Calibri")
windowsFonts(AB = windowsFont("Arial Black"))
text(3, 1, family = "AB", "Text in Arial Black")
windowsFonts(CM = windowsFont("Cambria Math"))
text(3, 0, family = "CM", "Text in Cambria Math")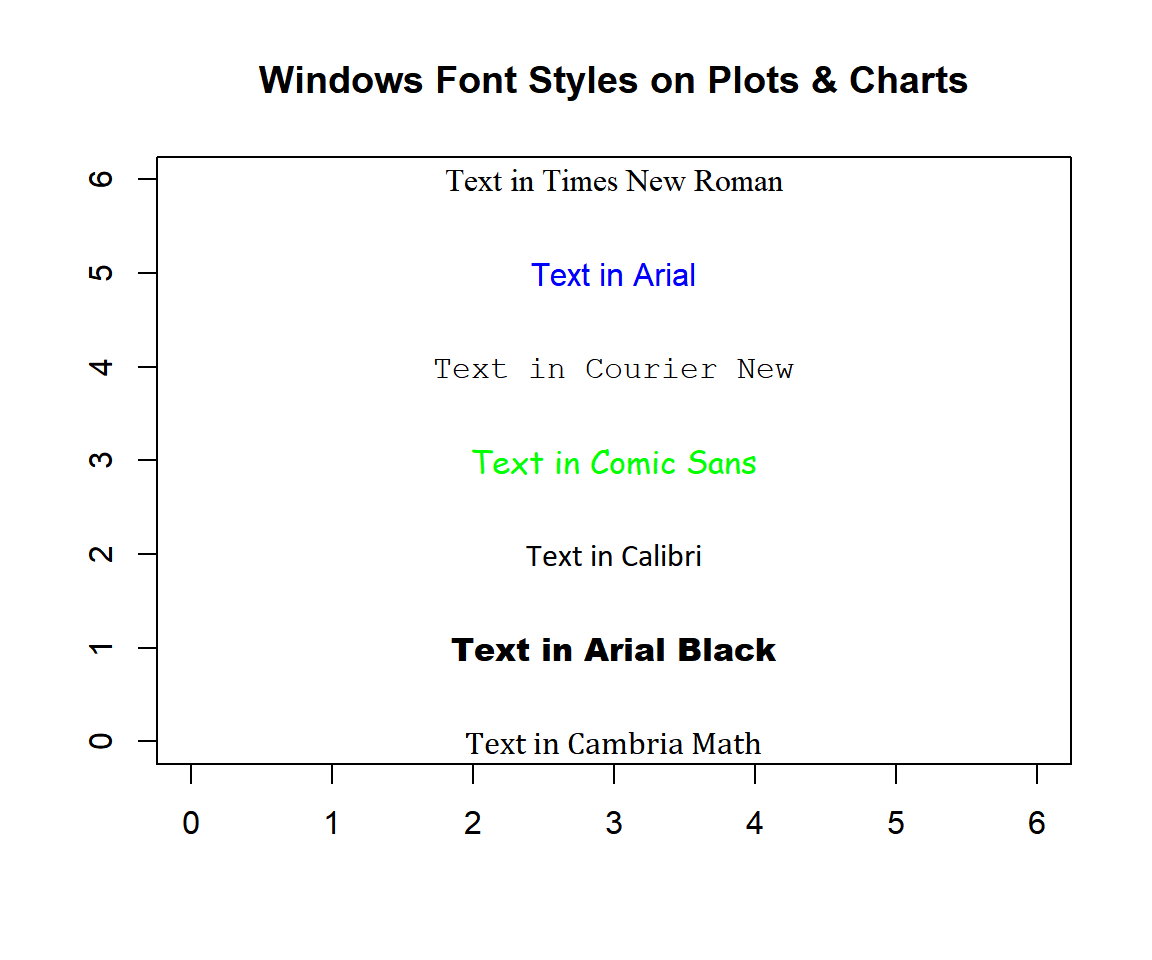
Windows Font Styles on Plots & Charts in R
3 Add Margin Text on Plots & Charts in R
The plot below shows margin texts using the mtext()
function.
The sides are 1 to 4 from the bottom to the left side in the
counterclockwise direction. The "side" argument is used to choose the
side, and the "adj" argument is used to shift the texts to the right
(adj = 1) or left (adj = 0) edge of the
reading direction.
plot(10, 10, pch = "",
     main = "", xlab = "", ylab = "",
     xaxt = "n", yaxt = "n")

# Top or Side = 3
mtext("Top side", side = 3, col = "blue")
mtext("Right of top side", side = 3, adj = 1, cex = 1.2)
mtext("Left of top side", side = 3, adj = 0)
mtext("3 lines inside from the top", side = 3, line = -3, cex = 1.5)
mtext("1 line away from the top (left shift)", side = 3, line = 1, adj = 0)

# Right or Side = 2
mtext("Left side", side = 2, col = "red")
mtext("1 line away from the left side", side = 2, line = 1, adj = 0)
mtext("2 lines inside from the left (right shift)", side = 2, line = -2, adj = 1)

# Left or Side = 4
mtext("Right side", side = 4, col = "green")
mtext("1 line away from the right side", side = 4, line = 1)
mtext("3 lines inside from the right (left shift)", side = 4, line = -3, adj = 0)

# Bottom or Side = 1
mtext("Bottom side", side = 1, col = "gold")
mtext("1 line inside from the bottom", side = 1, line = -1, cex = 1.5)
mtext("2 lines away from the bottom side (right shift)", side = 1, line = 2, adj = 1)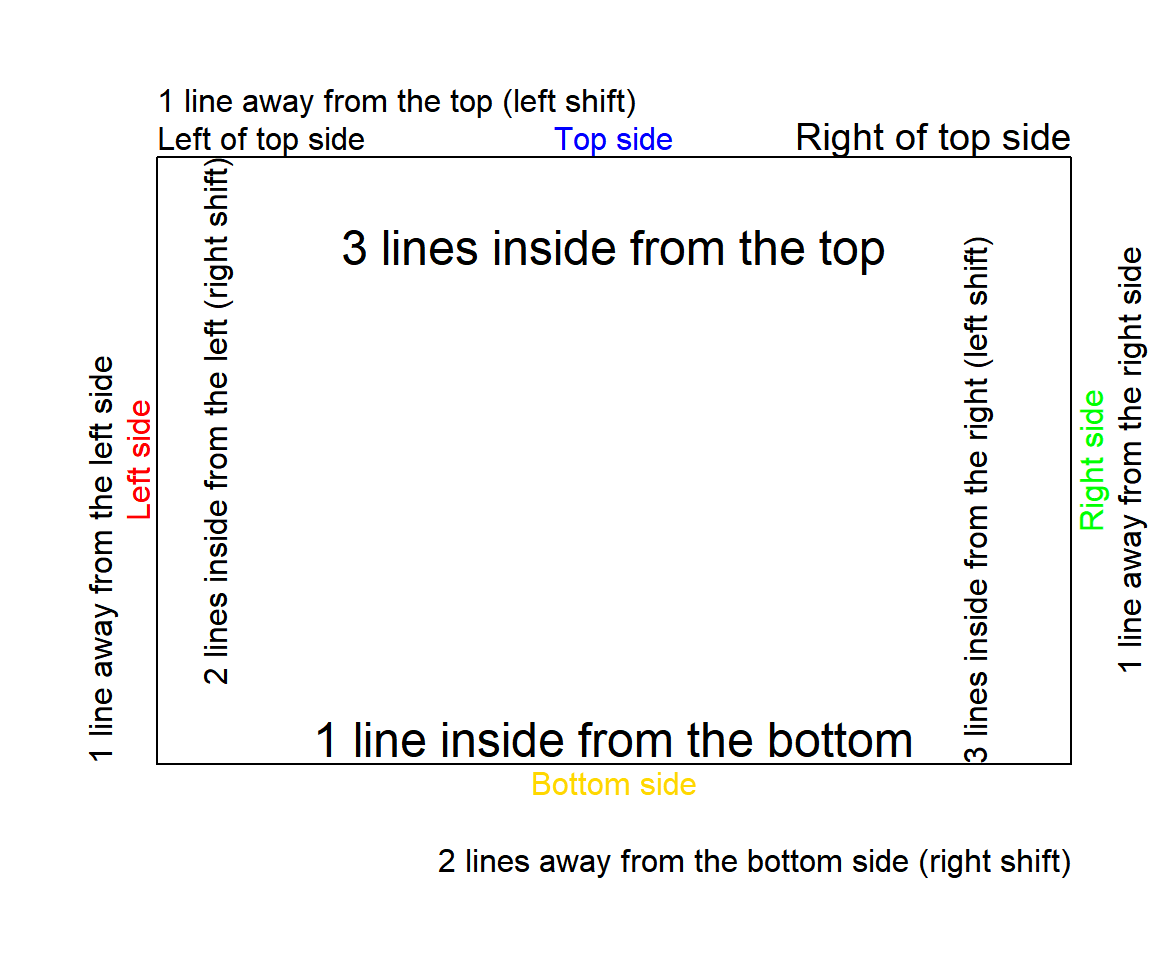
Margin Text on Plots & Charts in R
4 Add Counts or Frequencies as Text on Histogram in R
To add texts of counts or frequencies to histogram bars, first assign a name to your histogram object then add text to the object.
In the text() function, the first two arguments are the
x and y co-ordinates where the counts will be centered in the plot area,
and the third are the values shown. The "adj" argument is used to shift
the texts slightly above the x-y co-ordinate center.
data = PlantGrowth$weight
hplt = hist(data,
            xlab = "Weight", ylab = "Frequency",
            main = "Texts of Counts or Frequencies on Histogram",
            ylim = c(0, 10))

# Add counts
text(hplt$mids, hplt$counts, hplt$counts, adj = c(0.5, -0.5), col = "blue")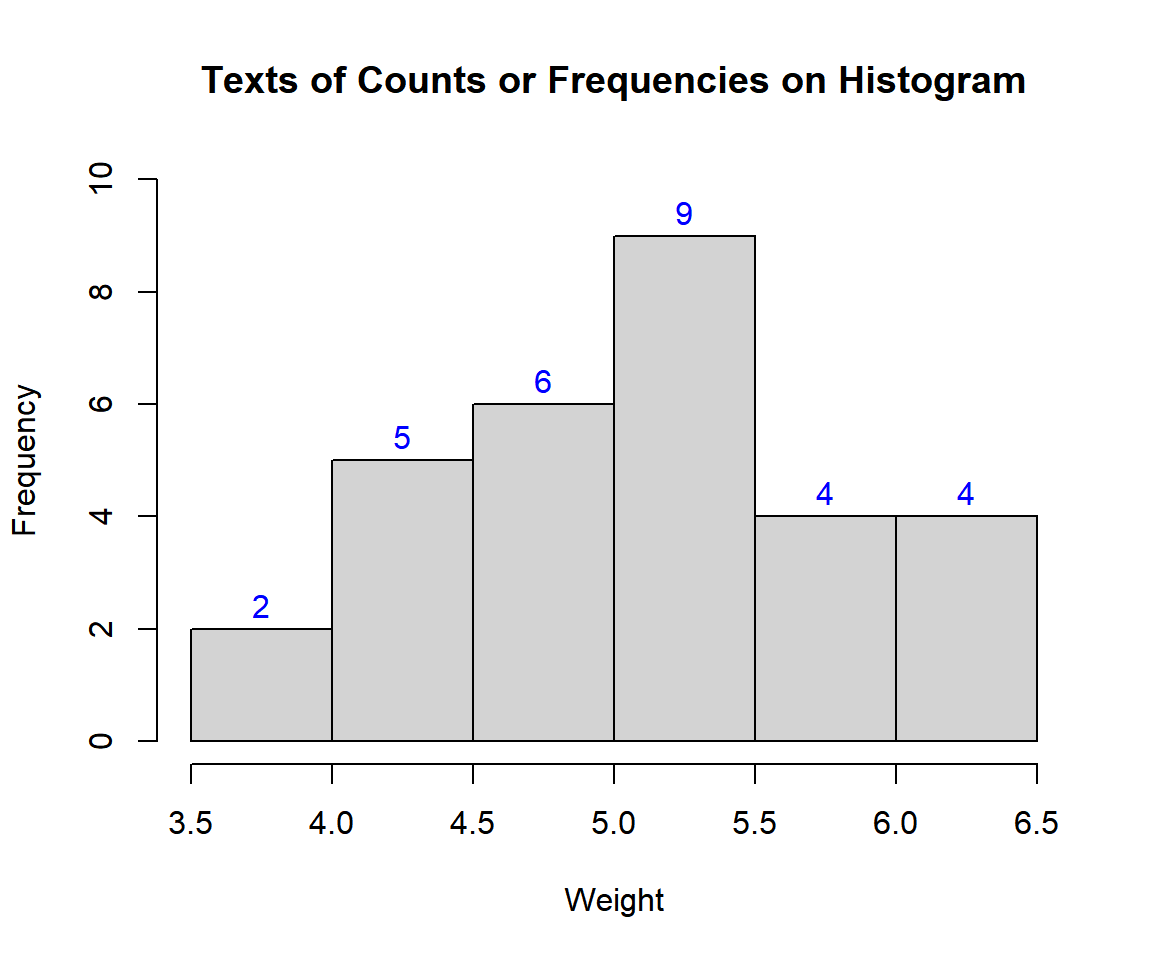
Texts of Counts or Frequencies on Histogram in R
5 Add Counts or Frequencies as Texts on Bar Chart in R
To add texts of counts or frequencies to bar charts, first assign a name to your bar chart object then add texts.
In the text() function, the first two arguments are the
x and y co-ordinates where the counts will be centered in the plot area,
and the third are the values shown. The "adj" argument is used to shift
the texts slightly above the x-y co-ordinate center.
Q1 = c(45, 53, 67, 62, 70)
Year = c("2011", "2012", "2013", "2014", "2015")
bplt = barplot(Q1 ~ Year, ylim = c(0, 80),
               main = "Texts of Counts or Frequencies on Bar Plot")

# Add counts
text(bplt, Q1, Q1, adj = c(0.5, -0.5), col = "red")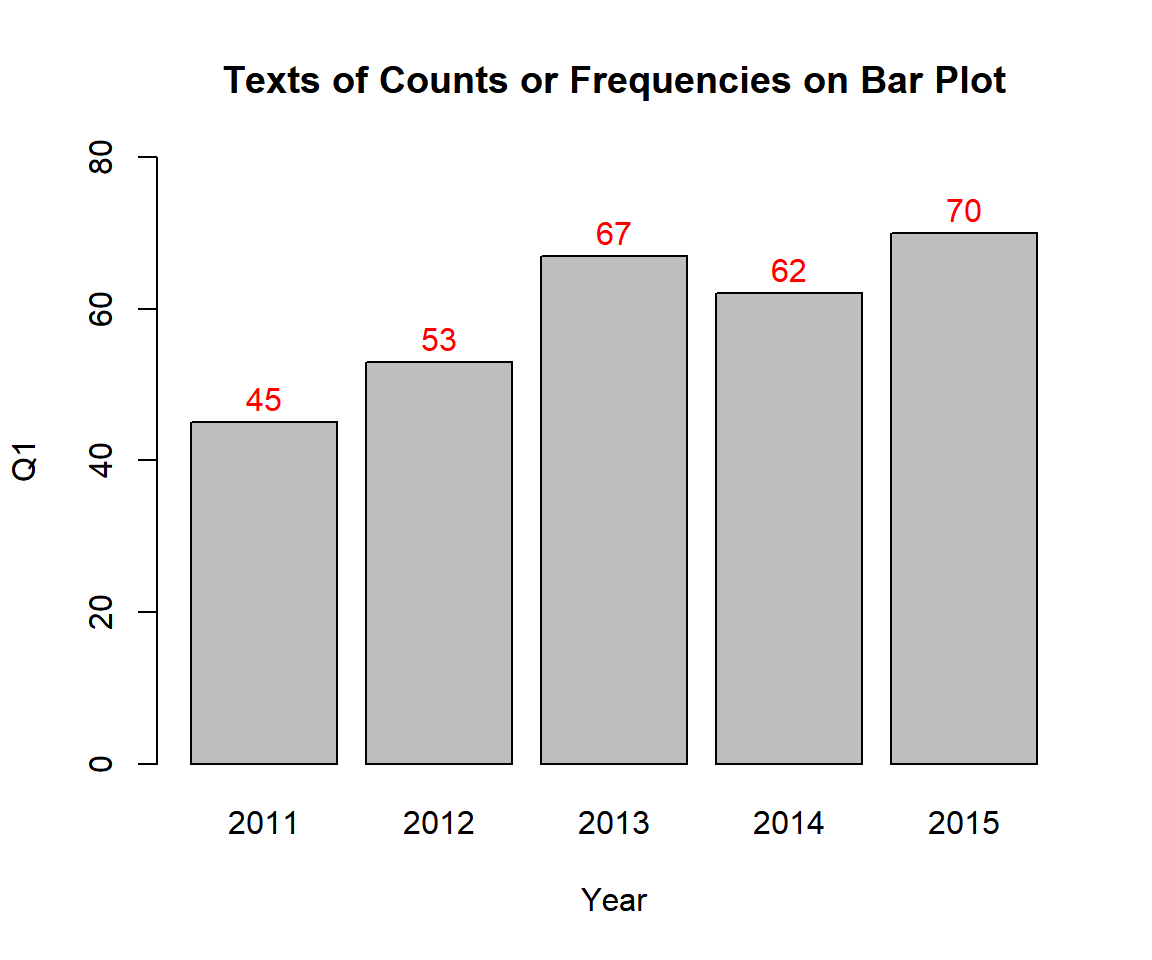
Texts of Counts or Frequencies on Bar Plot in R
The feedback form is a Google form but it does not collect any personal information.
Please click on the link below to go to the Google form.
Thank You!
Go to Feedback Form
Copyright © 2020 - 2026. All Rights Reserved by Stats Codes