Line Types & Line Widths in R
Here we introduce line types and line widths in R. How to set the line type, and change the line width.
See also line charts, density plots and lines & segments.
| Argument | Usage |
| lty | Setting line type |
| lwd | Setting line width |
| col | Set line color |
1 Line Types in R
In this section we show the main line types in R for use in plots like density plots and line charts.
This is set with the argument "lty", for example, lty = 1 or lty = "dashed". Options available include, "blank", "solid", "dashed", "dotted", "dotdash", "longdash", "twodash" and so on.
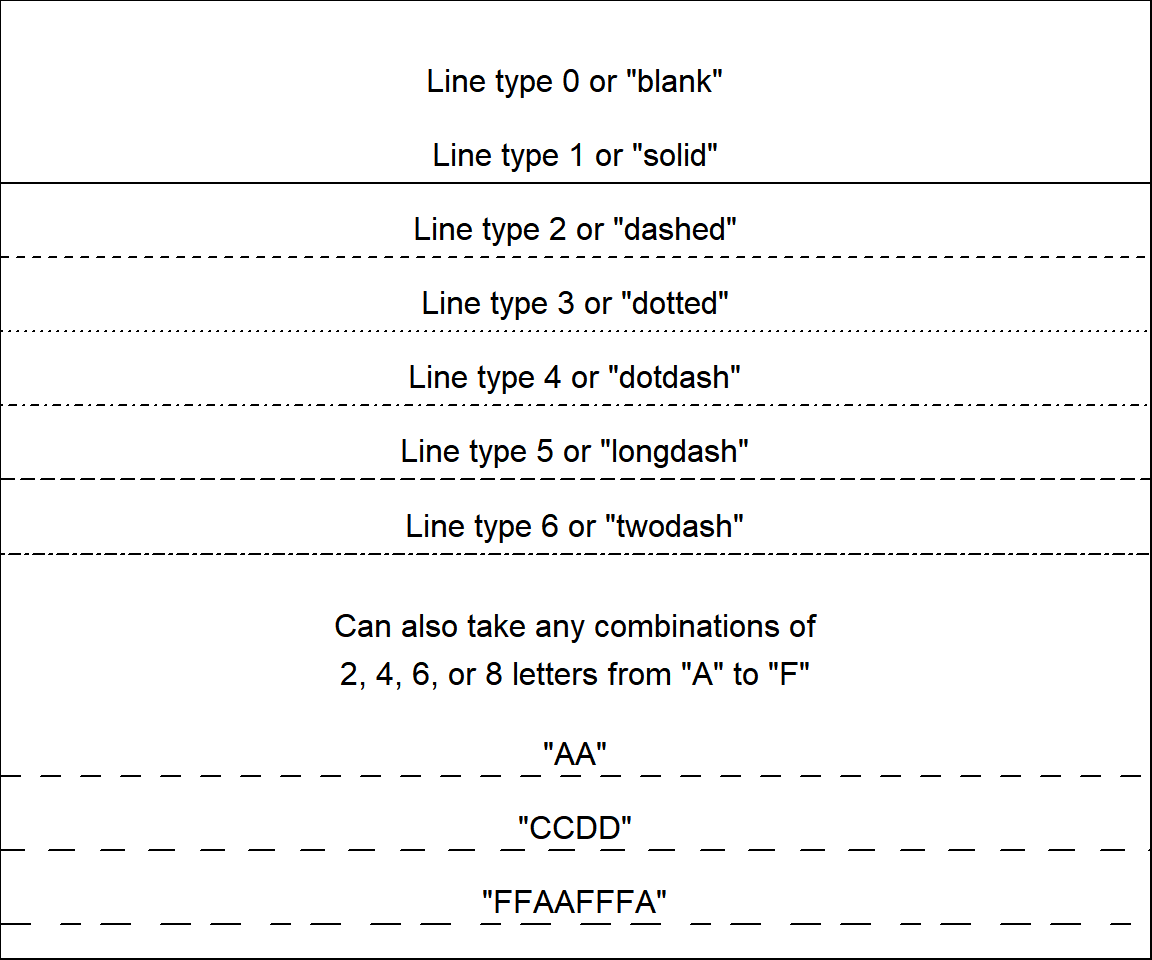
Plot Line Types in R
See examples below.
2 Line Widths in R
In this section we show how to set the line widths in R for use in plots like density plots and line charts plots.
This is set with the argument "lwd", for example, lwd = 1 or lwd = 3.
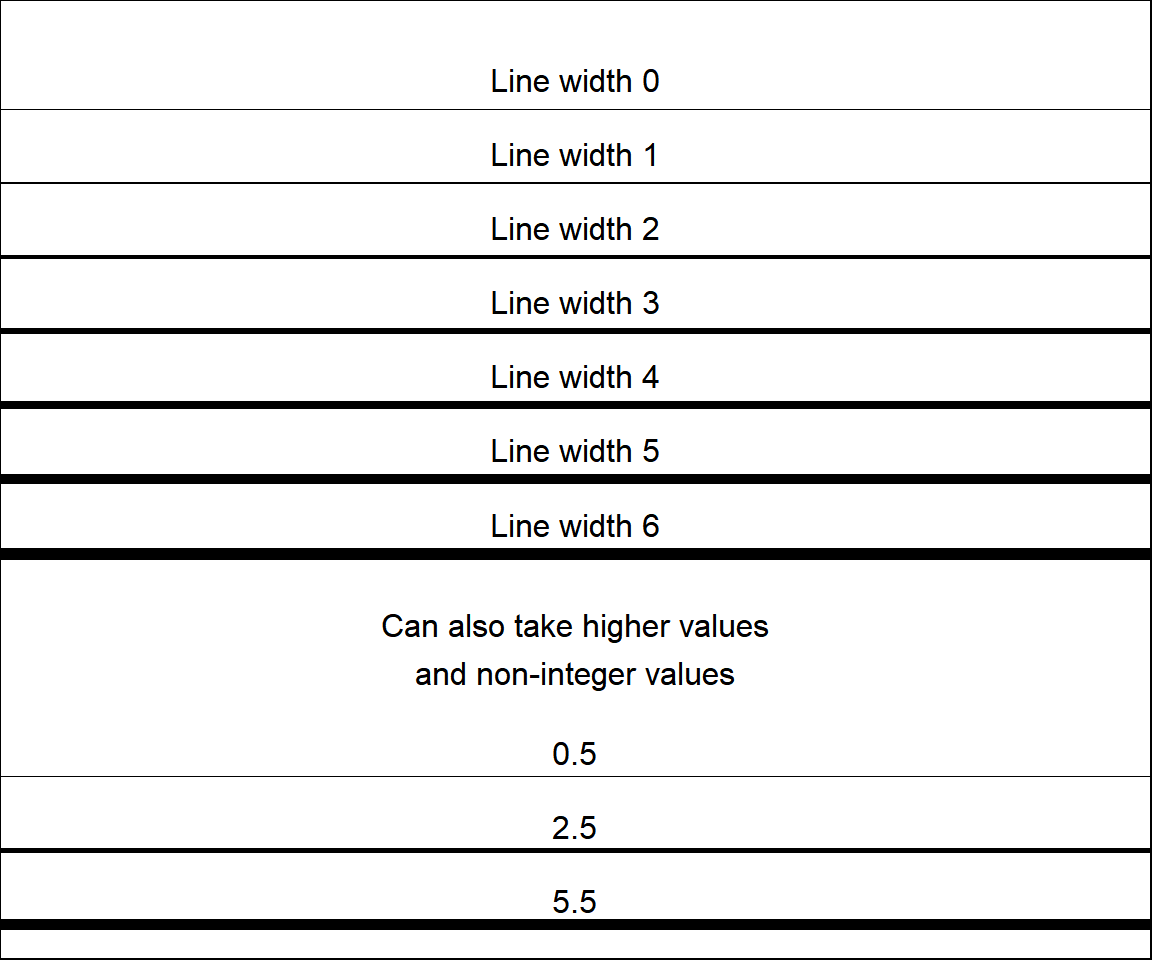
Plot Line Widths in R
See examples below.
3 Examples: Setting Line Types and Line Widths in R
Here, we show some examples setting the line types and widths as shown above.
Example using a density histogram:
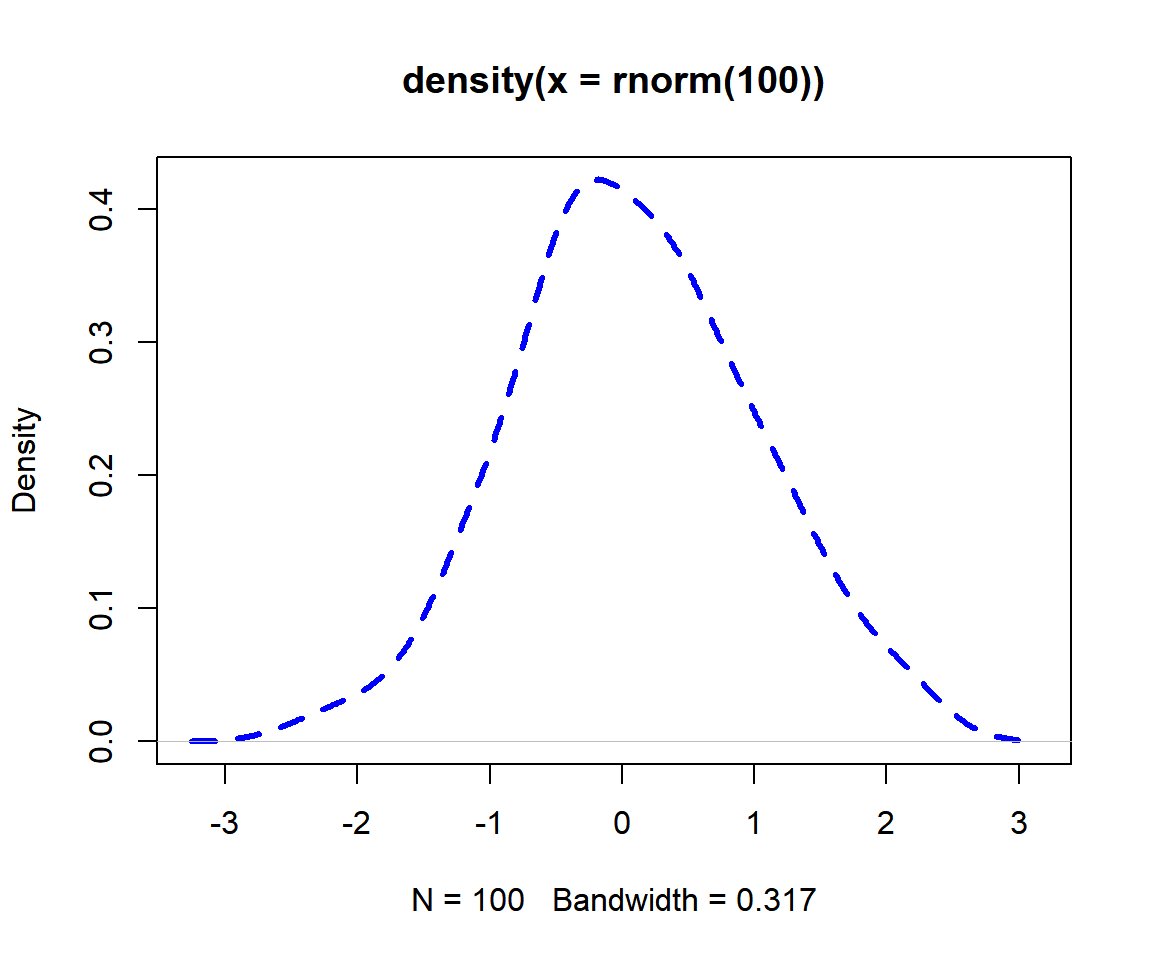
Line Types and Line Widths in R - Density Histogram
Example using a line chart:
set.seed(1234)
linedata = rnorm(30)
plot(linedata, type = "l",
     lty = "dotted",
     lwd = 1.5,
     col = "red")
Line Types and Line Widths in R - Line Chart
The feedback form is a Google form but it does not collect any personal information.
Please click on the link below to go to the Google form.
Thank You!
Go to Feedback Form
Copyright © 2020 - 2026. All Rights Reserved by Stats Codes