Setting Colors and Fonts on Plots & Charts in R
Here we show how to set graphical parameters in R, for colors, font types, and font sizes of plot titles, labels, axis, sub-titles, and borders.
See also colors, texts on plots, and mathematical expressions on plots.
1 Parameters for Setting Colors and Font Types & Sizes in R
This section will show some of the arguments for setting graphical parameters on plots and charts in R.
| Region | Text | Font Size | Font Type | Color |
| General | for no plot: type = "n" | cex | font | col |
| Main | main | cex.main | font.main | col.main |
| Labels | xlab & ylab | cex.lab | font.lab | col.lab |
| Axis | limits: xlim & ylim no axis: xaxt = "n", yaxt = "n" |
cex.axis | font.axis | col.axis |
| Sub-titles | sub | cex.sub | font.sub | col.sub |
| Border | border | |||
| Background | bg | |||
| Foreground | fg |
2 Examples Setting Colors and Font Types & Sizes in R
Here, we show some examples setting the graphical parameters shown above.
2.1 Example: Using a Histogram
The example below shows how to set graphical parameters using a histogram.
set.seed(12)
histdata = rnorm(100)
hist(histdata,
     main = "Plots and Charts Example in R - Histogram",
     xlab = "X Label Here",
     ylab = "Y Label Here",
     sub = "A Plot Sub",
     xlim = c(-4, 4),
     ylim = c(0, 30),
     cex = 1, cex.main = 1.4, cex.lab = 1.2,
     cex.axis = 0.8, cex.sub = 0.8,
     font = 1, font.main = 2, font.lab = 4,
     font.axis = 3, font.sub = 2,
     col = "orange", col.main = "orange",
     col.lab = "magenta", col.axis = "cyan",
     col.sub = "khaki",
     border = "red", bg = "white", fg = "limegreen")
Setting Colors and Font Types & Sizes on Plots and Charts in R - Histogram
2.2 Example: Using a Boxplot
The example below shows how to set graphical parameters using a boxplot.
set.seed(1234)
boxdata = rnorm(30)
boxgroup = c(rep("A", 10), rep("B", 10), rep("C", 10))
boxplot(boxdata ~ boxgroup,
     main = "Plots and Charts Example in R - BoxPlot",
     xlab = "Groups",
     ylab = "Range",
     sub = "Sub Statement",
     ylim = c(-3, 3),
     cex = 1.2, cex.main = 1.5, cex.lab = 1.2,
     cex.axis = 0.8, cex.sub = 1,
     font = 3, font.main = 4, font.lab = 2,
     font.axis = 1, font.sub = 3,
     col = c("limegreen", "gray", "pink"),
     col.main = "navy", col.lab = "tomato",
     col.axis = "royalblue", col.sub = "plum",
     border = "blue")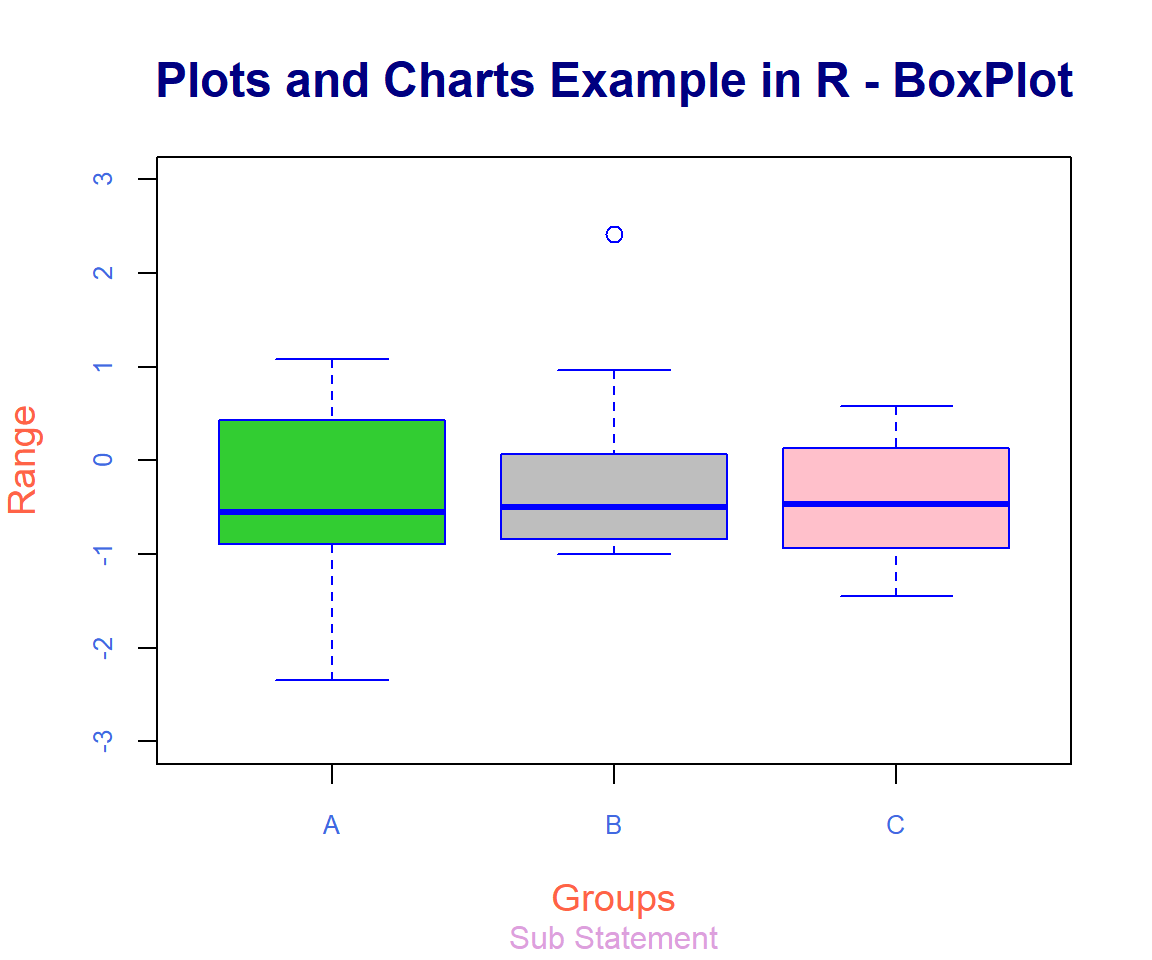
Setting Colors and Font Types & Sizes on Plots and Charts in R - BoxPlot
The feedback form is a Google form but it does not collect any personal information.
Please click on the link below to go to the Google form.
Thank You!
Go to Feedback Form
Copyright © 2020 - 2026. All Rights Reserved by Stats Codes