Mathematical Expressions, Notations and Greeks on Plots and Titles in R
- 1 Mathematical Expressions on Plots in R
- 2 Mathematical Operations and Relations on Plots in R
- 3 Greek Alphabets on Plots and Titles in R
- 4 Mathematical Symbols on Plots and Titles in R
- 5 Functions and Function Notations on Plots in R
- 6 Set and Logic Notations on Plots in R
- 7 Textsytles, Scripts and Fractions on Plots in R
Here we discuss mathematical expressions, operations, equations, and notations on plots and titles in R, with examples including Greek alphabets on plots.
These will be done using the text() function from the
"graphics" package.
See also texts and counts on plots.
| Argument | Usage |
| col | Set expression color |
| cex | Set expression font size |
| adj | Shift expression from the center |
1 Mathematical Expressions on Plots in R
Here we show some standard mathematical expressions on a plot. The first two arguments are the x and y co-ordinates where the mathematical expression will be centered in the plot area.
plot(12, 12, pch = "",
     xlim = c(0,12), ylim = c(0,12),
     xlab = "", ylab = "",
     main = "Mathematical Expressions on Plots ")

# Expression Codes

text(6, 9, expression(bar(x) == sum(frac(x[i], n), i==1, n)))
text(6, 5, expression(hat(beta) == (X^t * X)^{-1} * X^t * y), col = "blue")
text(6, 1, expression(paste(frac(1, sigma*sqrt(2*pi)), " ",
           plain(e)^{frac(-(x-mu)^2, 2*sigma^2)})))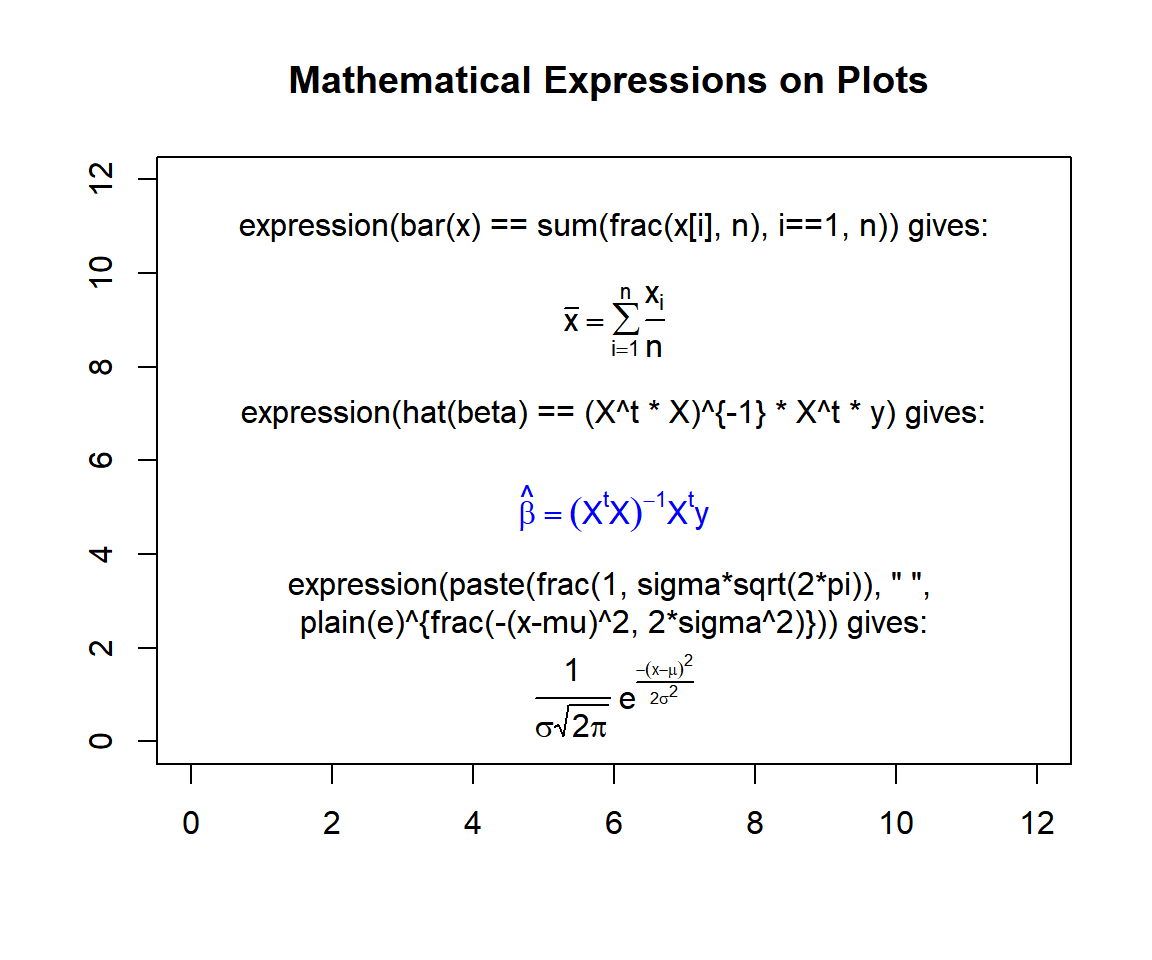
Mathematical Expressions on Plots in R
2 Mathematical Operations and Relations on Plots in R
Here we show various mathematical operations and relations on plots, including, addition, subtraction, multiplication, and division on plots. The first two arguments are the x and y co-ordinates where the operations and relations will be centered in the plot area.
plot(3, 3, pch = "",
     xlim = c(0,3), ylim = c(0,3),
     xlab = "", ylab = "",
     main = "Mathematical Operations and Relations on Plots")

# Expression Codes

text(1, 2, expression(x + y), cex = 2, col = "green")
text(2, 2, expression(x - y), cex = 1.5)
text(1, 1, expression(x*y), cex = 1.5)
text(2, 1, expression(x/y), cex = 2, col = "red")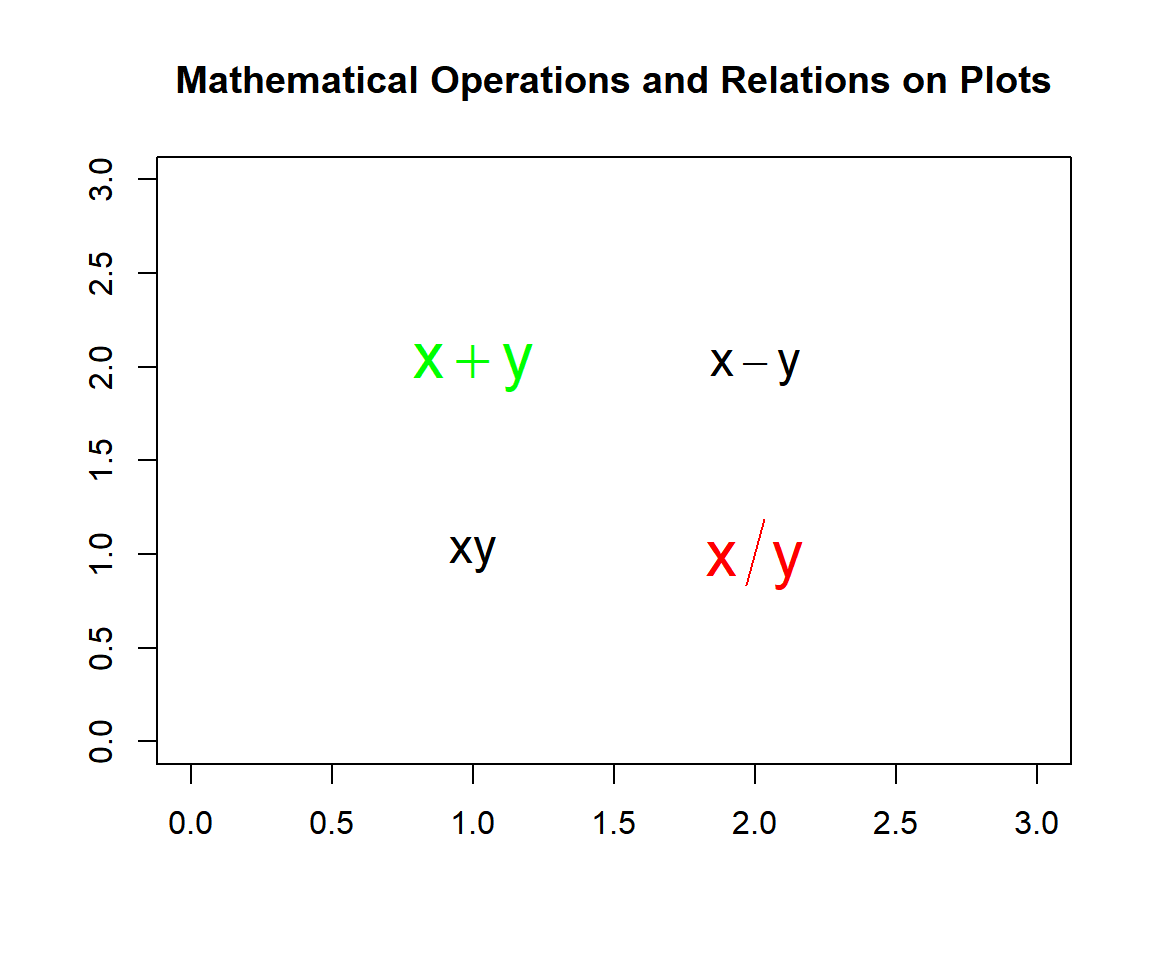
Mathematical Operations and Relations on Plots in R
More examples and the inputs for operations and relations such as "square root", "nth root", "square" or "powers", "less than", "less than or equal to", "greater than", "greater than or equal to", "not equal to", "approximately equal to", and so on, are shown below:
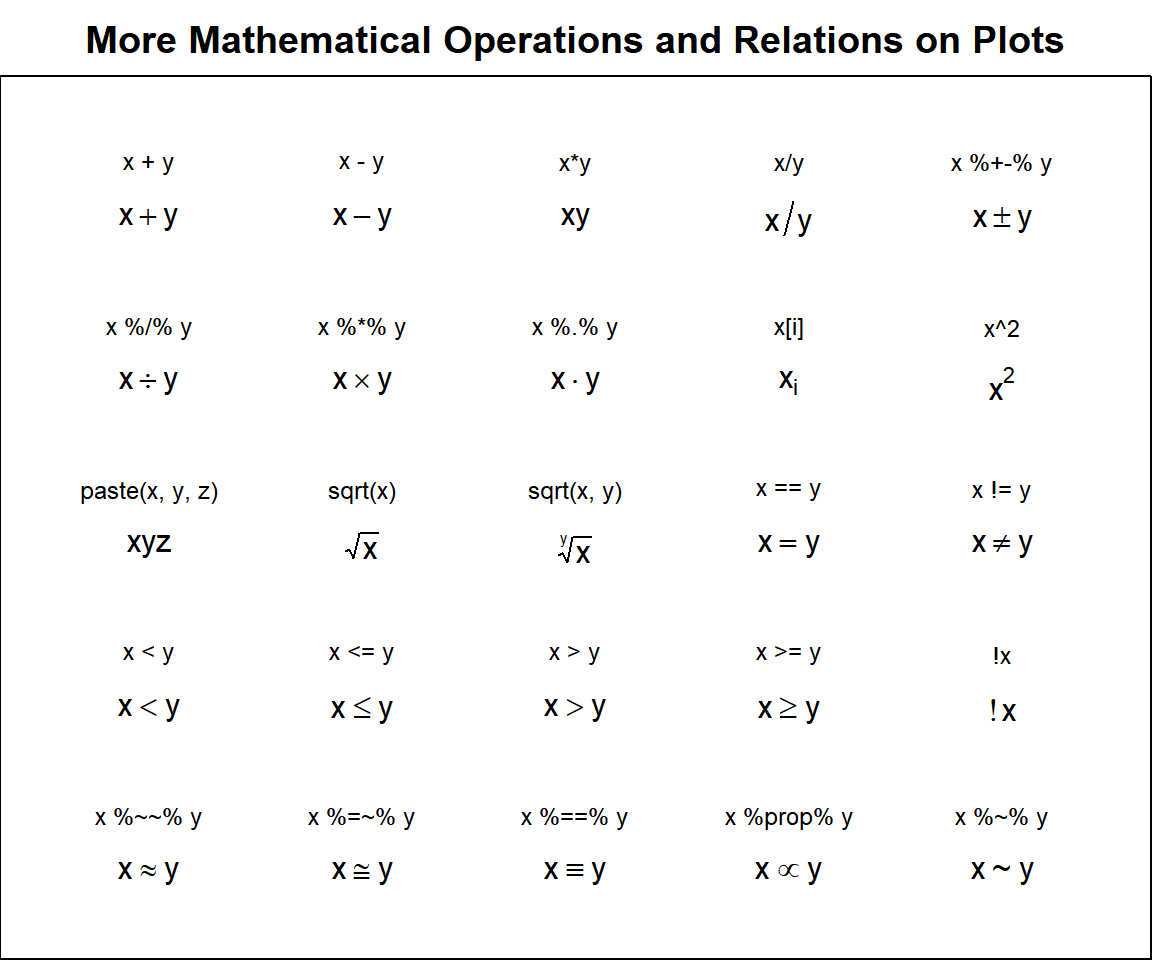
More Mathematical Operations and Relations on Plots in R
3 Greek Alphabets on Plots and Titles in R
Here we show how the Greek alphabets can be written on the plot area and titles. The first two arguments are the x and y co-ordinates where the Greek letters will be centered in the plot area, and the argument "adj" is used to shift the texts from the x-y co-ordinate center.
# Title expression code in the "main" argument

plot(3, 3, pch = "",
     xlim = c(0,3), ylim = c(0,3),
     xlab = "", ylab = "",
     main = expression(paste("Examples of Greek Alphabets on Plots and Titles",
                             ": ", Alpha, " to ", Omega)))

# Greek Alphabets Codes

text(1, 2, expression((gamma) (beta) (lambda)), cex = 2, col = "blue")
text(2, 2, expression(paste(mu, " = 3")), cex = 1.5, adj = c(0, 1))
text(2, 2, expression(paste(sigma, " = 3")), cex = 1.5, adj = c(0, -1))
text(1, 1, expression(paste(Alpha, " = 3, ", Gamma, " = 3")), cex = 1.5)
text(2, 1, expression(paste(mu, omega, sigma)), cex = 2, col = "green")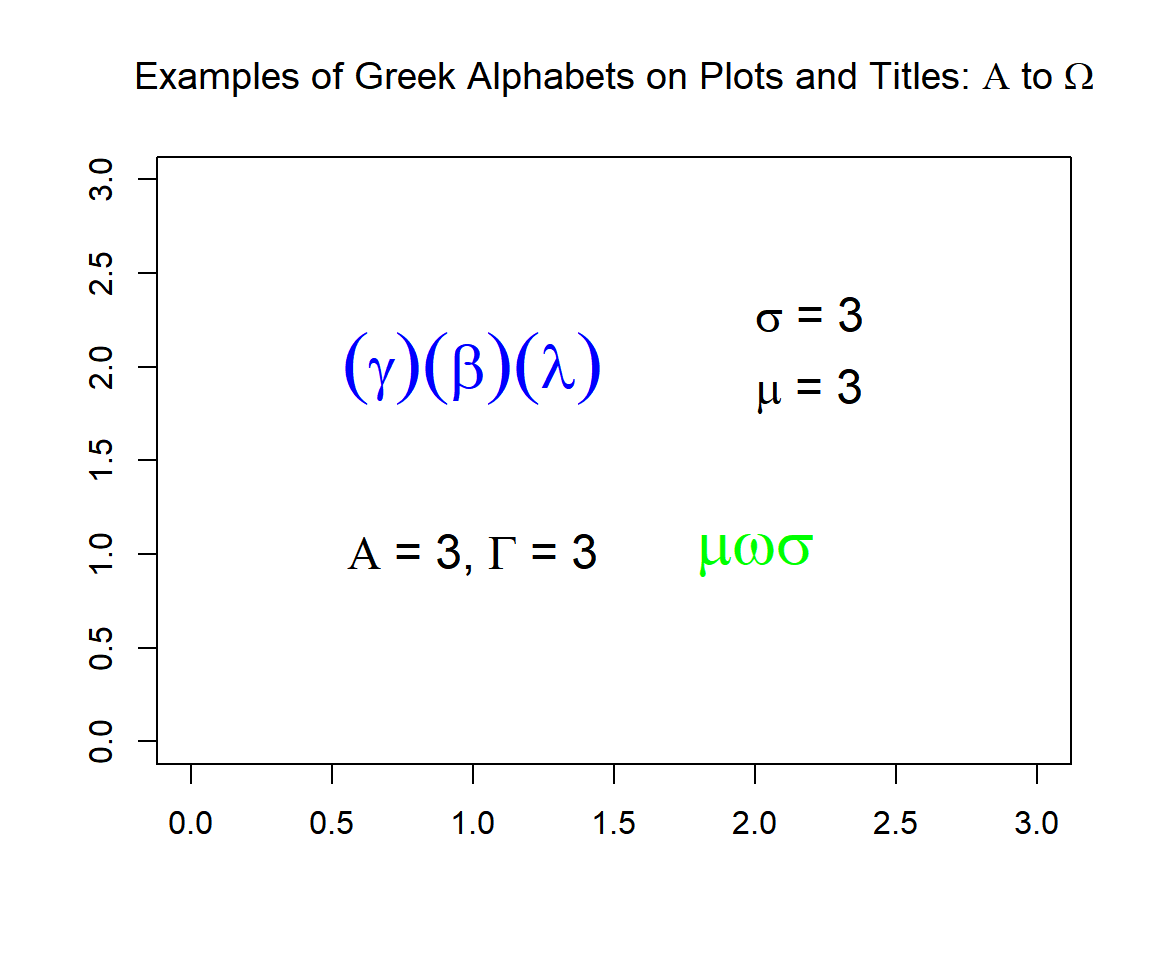
Examples of Greek Alphabets on Plots and Titles in R
The following can be used for all the Greek alphabets on plots and charts, including both lower and upper cases following the example above:
Lower = alpha, beta, gamma, delta, epsilon, zeta, eta, theta, iota, kappa, lambda, mu, nu, xi, omicron, pi, rho, sigma, tau, upsilon, phi, chi, psi, omega.
Upper = Alpha, Beta, Gamma, Delta, Epsilon, Zeta, Eta, Theta, Iota, Kappa, Lambda, Mu, Nu, Xi, Omicron, Pi, Rho, Sigma, Tau, Upsilon, Phi, Chi, Psi, Omega.
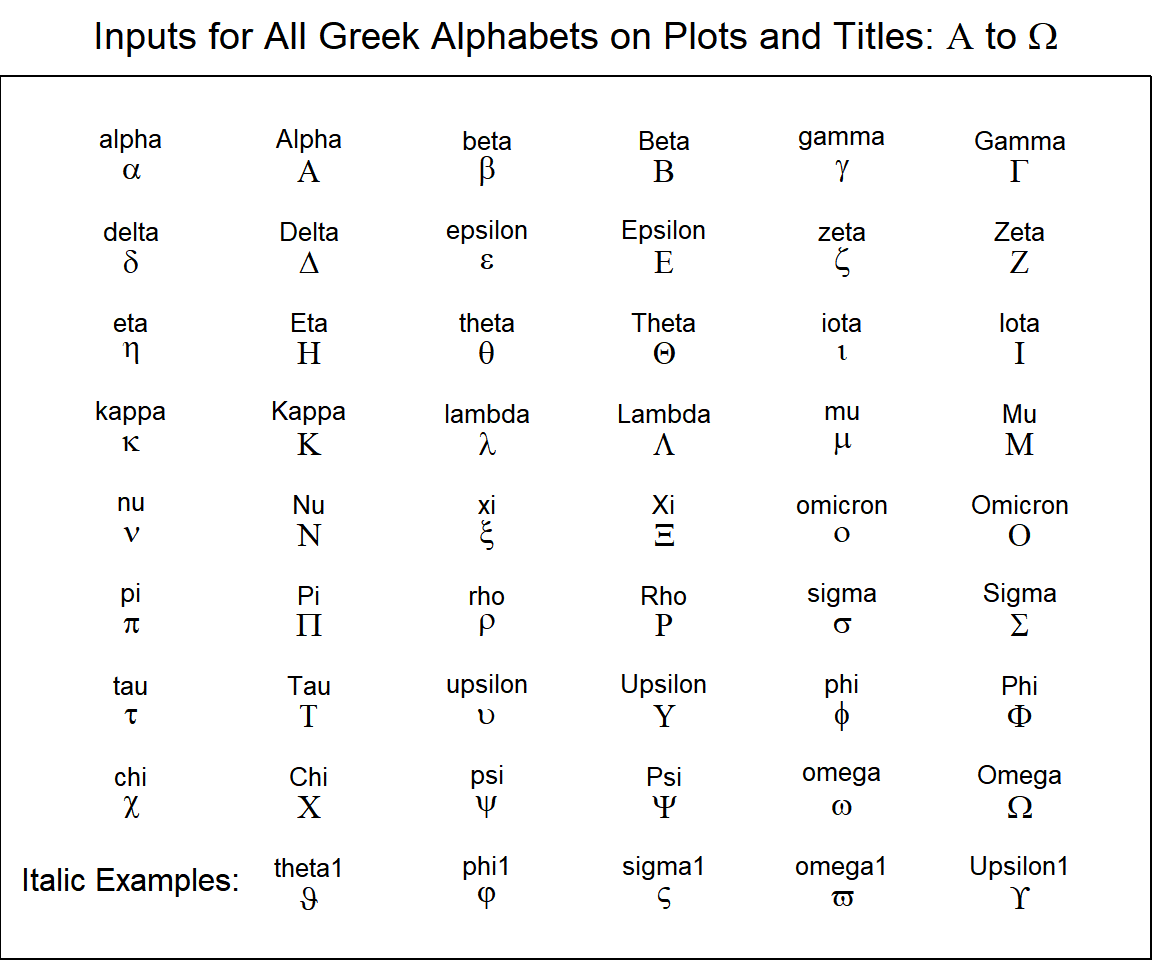
Inputs for All Greek Alphabets on Plots and Titles in R
4 Mathematical Symbols on Plots and Titles in R
Here we show mathematical symbols on plots and titles. The first two arguments are the x and y co-ordinates where the mathematical symbols will be centered in the plot area.
# Title expression code in the "main" argument

plot(0:3, 0:3, pch = "",
     xlab = "", ylab = "",
     main = expression(paste("Mathematical Symbols on Plots and Titles",
                             ": Like ", aleph, " & ", infinity)))
# Symbols Codes

text(1, 2, expression(aleph), cex = 1.5, col = "blue")
text(2, 2, expression(infinity), cex = 2, col = "red")
text(1, 1, expression(symbol("\042")), cex = 2)
text(2, 1, expression(symbol("\044")), cex = 1.5)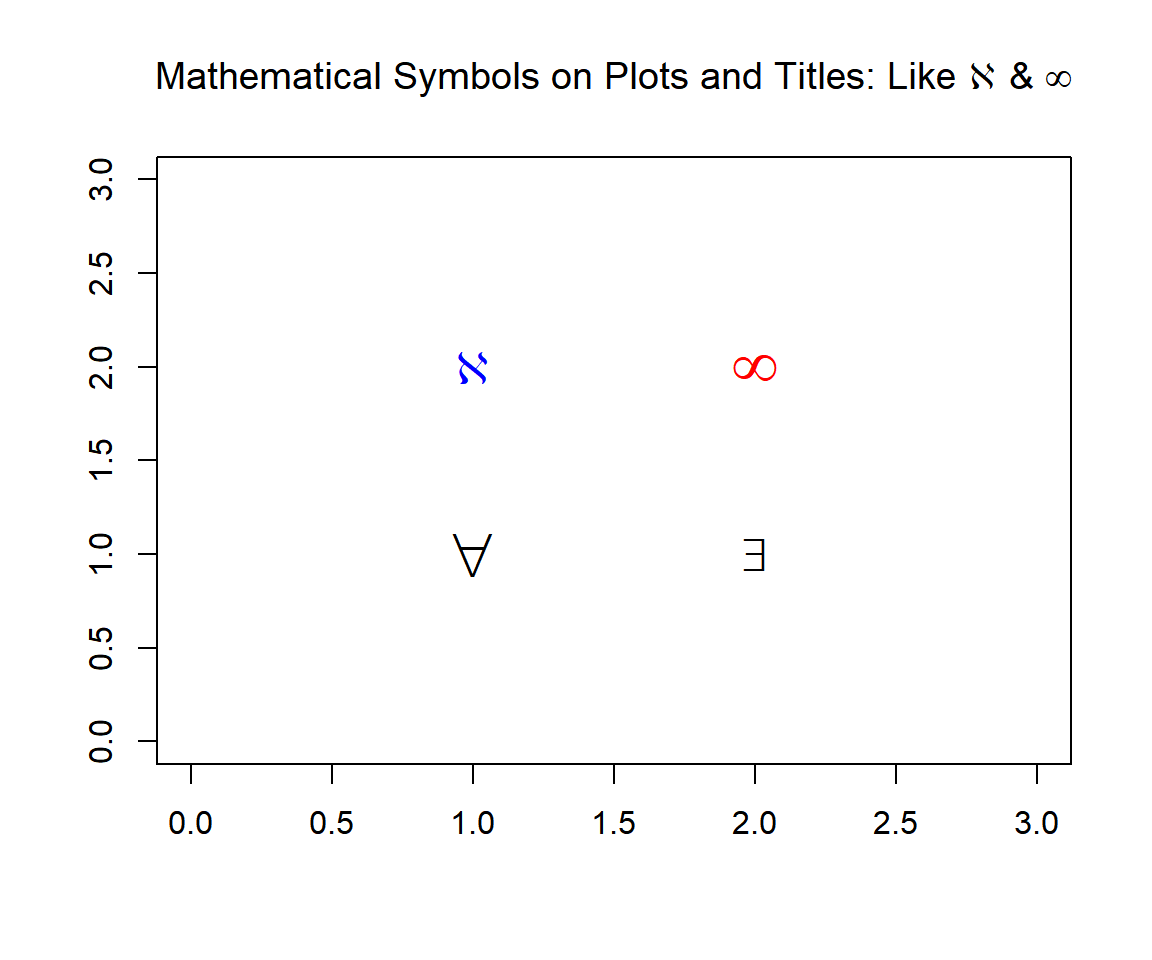
Mathematical Symbols on Plots and Titles in R
More examples and the inputs for mathematical symbols such as "infinity", "aleph", "universal" or "for all", "existential" or "there exists", "such that", "empty set", "therefore", "perpendicular", "angle", and so on, are shown below:
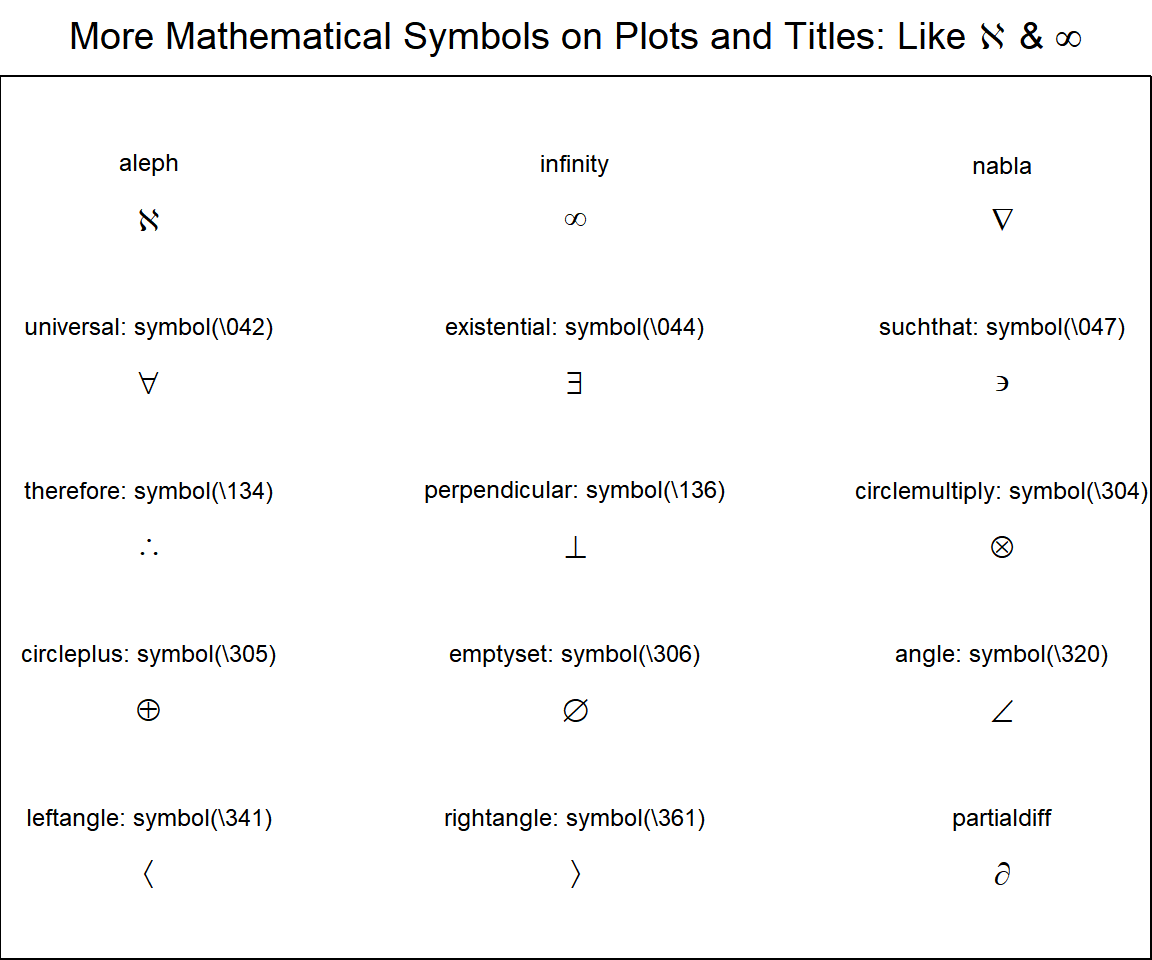
More Mathematical Symbols on Plots and Titles in R
5 Functions and Function Notations on Plots in R
Here we show functions and function notations on plots, including, sums, products, integral, limits, union, and intersections. The first two arguments are the x and y co-ordinates where the functions and function notations will be centered in the plot area.
plot(0:3, 0:3, pch = "",
     xlab = "", ylab = "",
     main = "Functions and Function Notations on Plots")

# Functions and Function Notations Codes

text(1, 2, expression(prod(plain(P)(X==x), x)), cex = 1.5)
text(2, 2, expression(integral(f(x)*dx, a, b)), cex = 2)
text(1, 1, expression(intersect(A[i], i==1, n)), cex = 2, col = "red")
text(2, 1, expression(lim(f(x), x %->% 0)), cex = 1.5)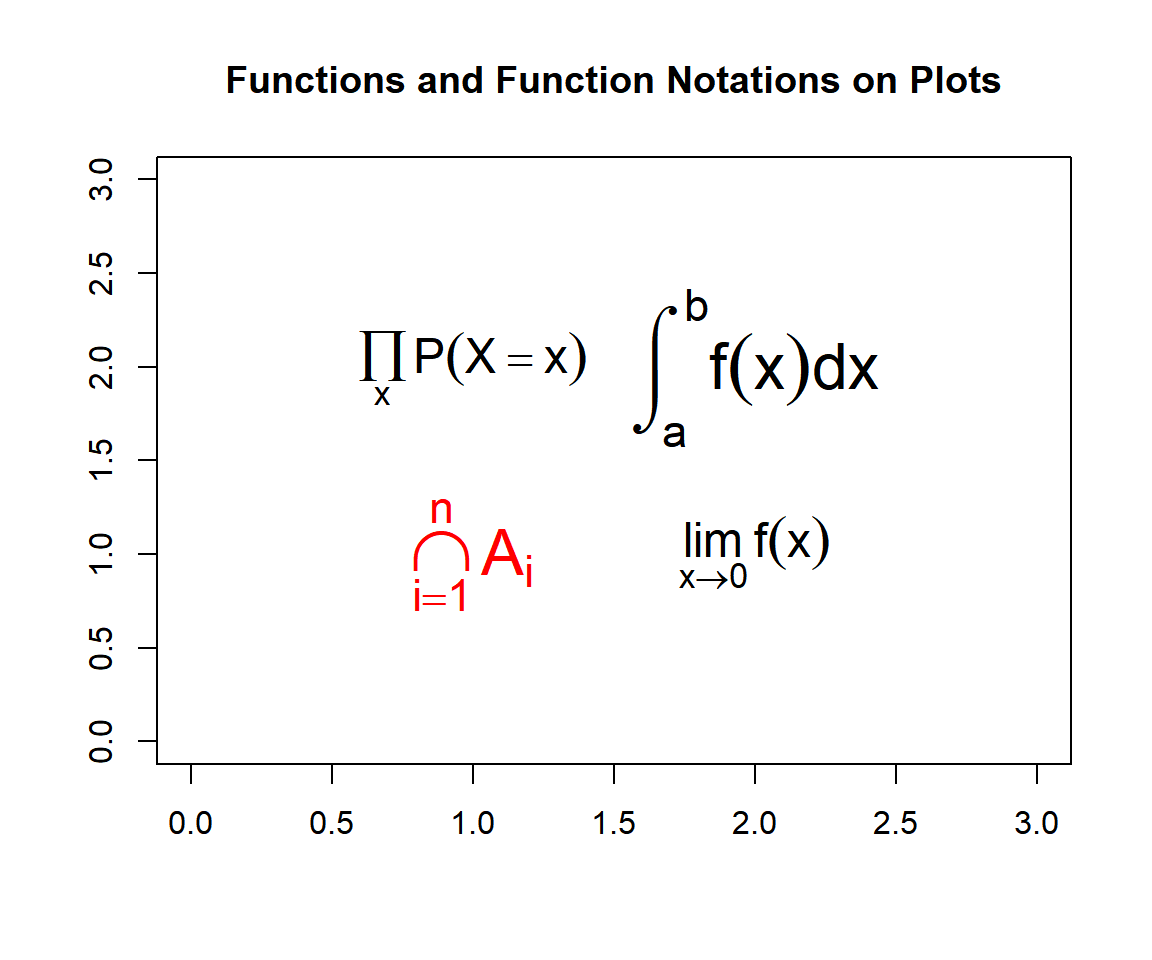
Functions and Function Notations on Plots in R
More examples and the inputs for functions and function notations are shown below:
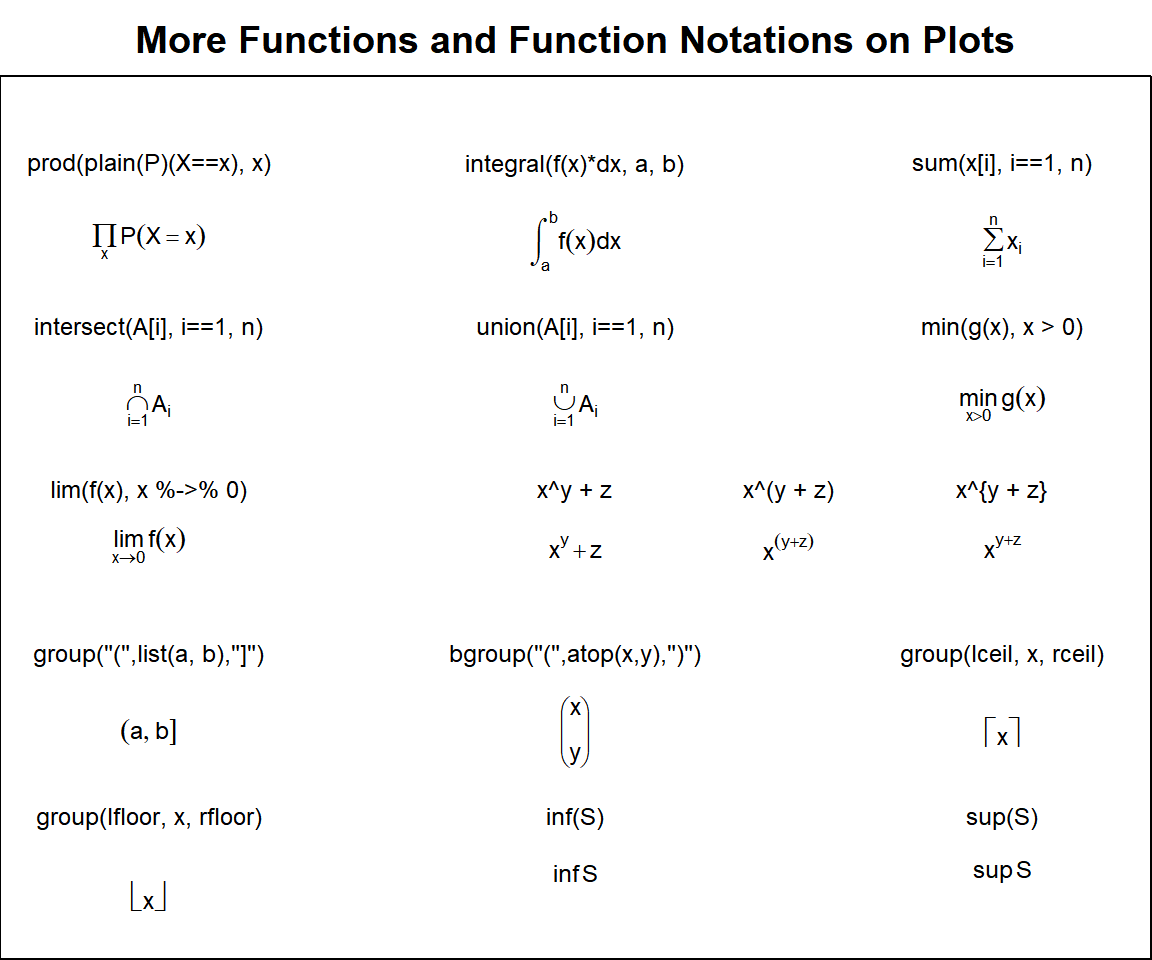
More Functions and Function Notations on Plots in R
6 Set and Logic Notations on Plots in R
Here we show set and logic notations on plots, including ellipsis, subset, superset, element, arrows, hats and tildes. The first two arguments are the x and y co-ordinates where the set and logic notations will be centered in the plot area.
plot(0:3, 0:3, pch = "",
     xlab = "", ylab = "",
     main = "Set and Logic Notations on Plots")

# Set and Logic Notations Codes

text(1, 2, expression(cdots), cex = 1.5)
text(2, 2, expression(x %subseteq% y), cex = 2, col = "blue")
text(1, 1, expression(x %notin% y), cex = 2, col = "red")
text(2, 1, expression(tilde(x)), cex = 1.5)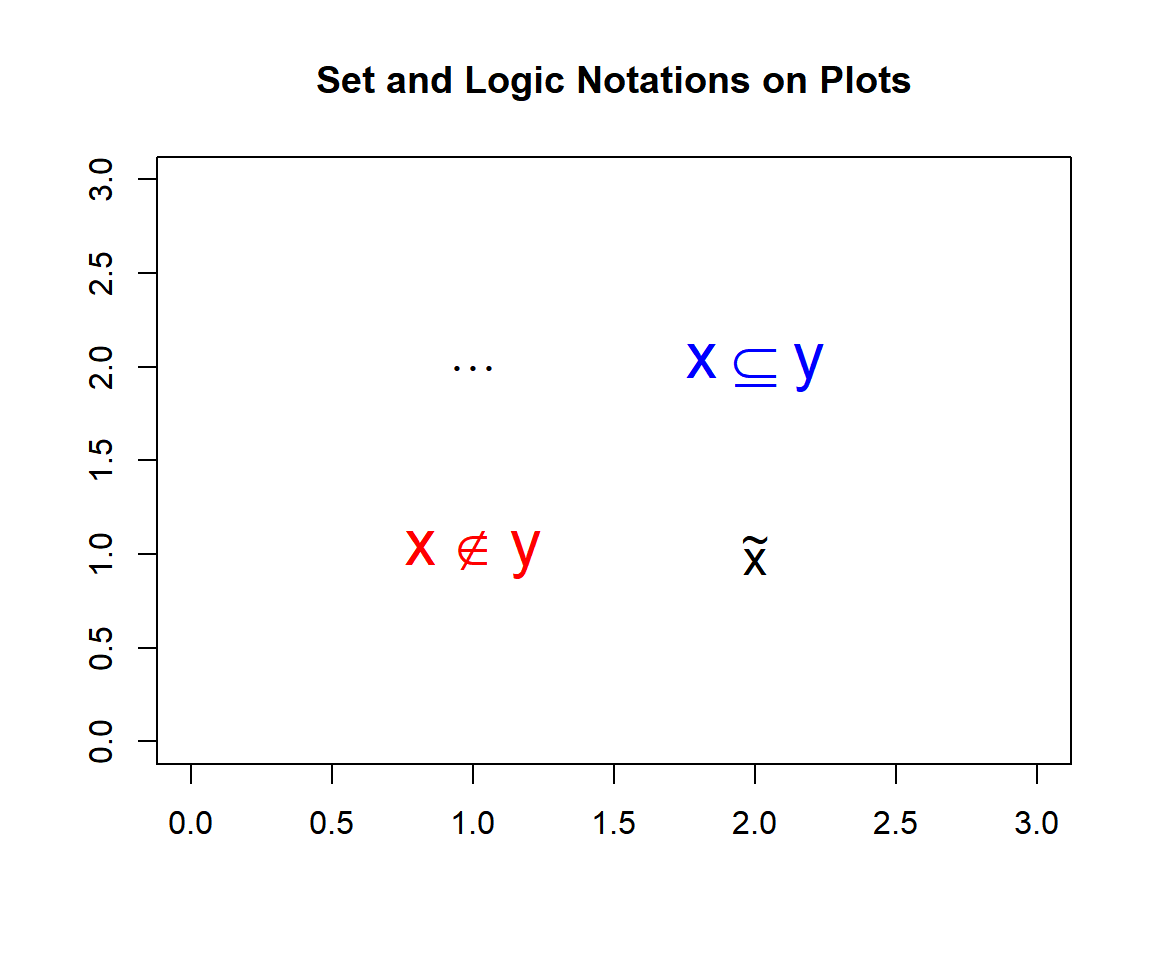
Set and Logic Notations on Plots in R
More examples and the inputs for set and logic notations are shown below:
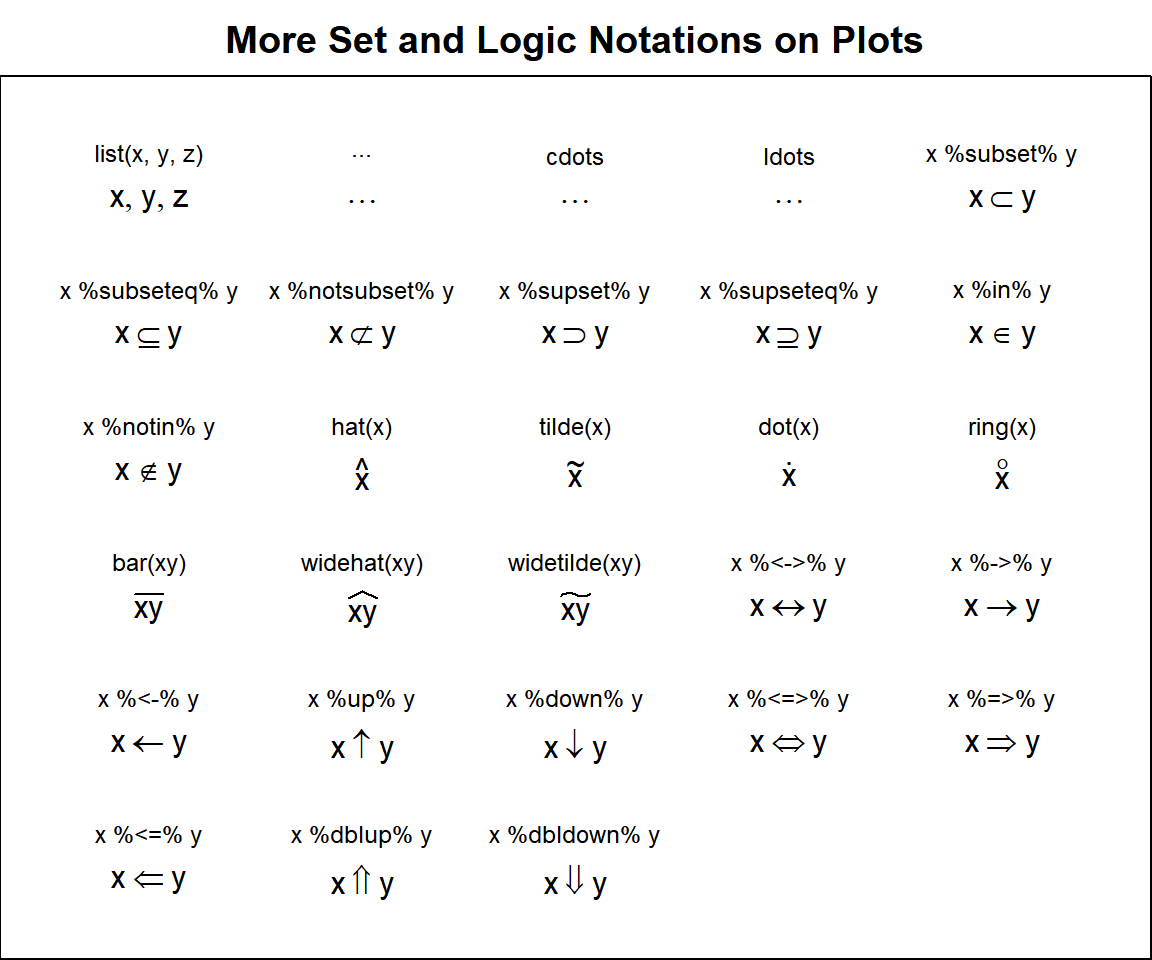
More Set and Logic Notations on Plots in R
7 Textsytles, Scripts and Fractions on Plots in R
Here we show textstyles, scripts, and fractions on plots. The first two arguments are the x and y co-ordinates where the scripts and fractions will be centered in the plot area.
plot(0:3, 0:3, pch = "",
     xlab = "", ylab = "",
     main = "Textsytles, Scripts and Fractions Plots")

# Textsytles, Scripts and Fractions Codes

text(1, 2, expression(underline(x)), cex = 2)
text(2, 2, expression(atop(x, y)), cex = 1.5)
text(1, 1, expression(32*degree), cex = 1.5, col= "green")
text(2, 1, expression(30*second), cex = 2, col = "blue")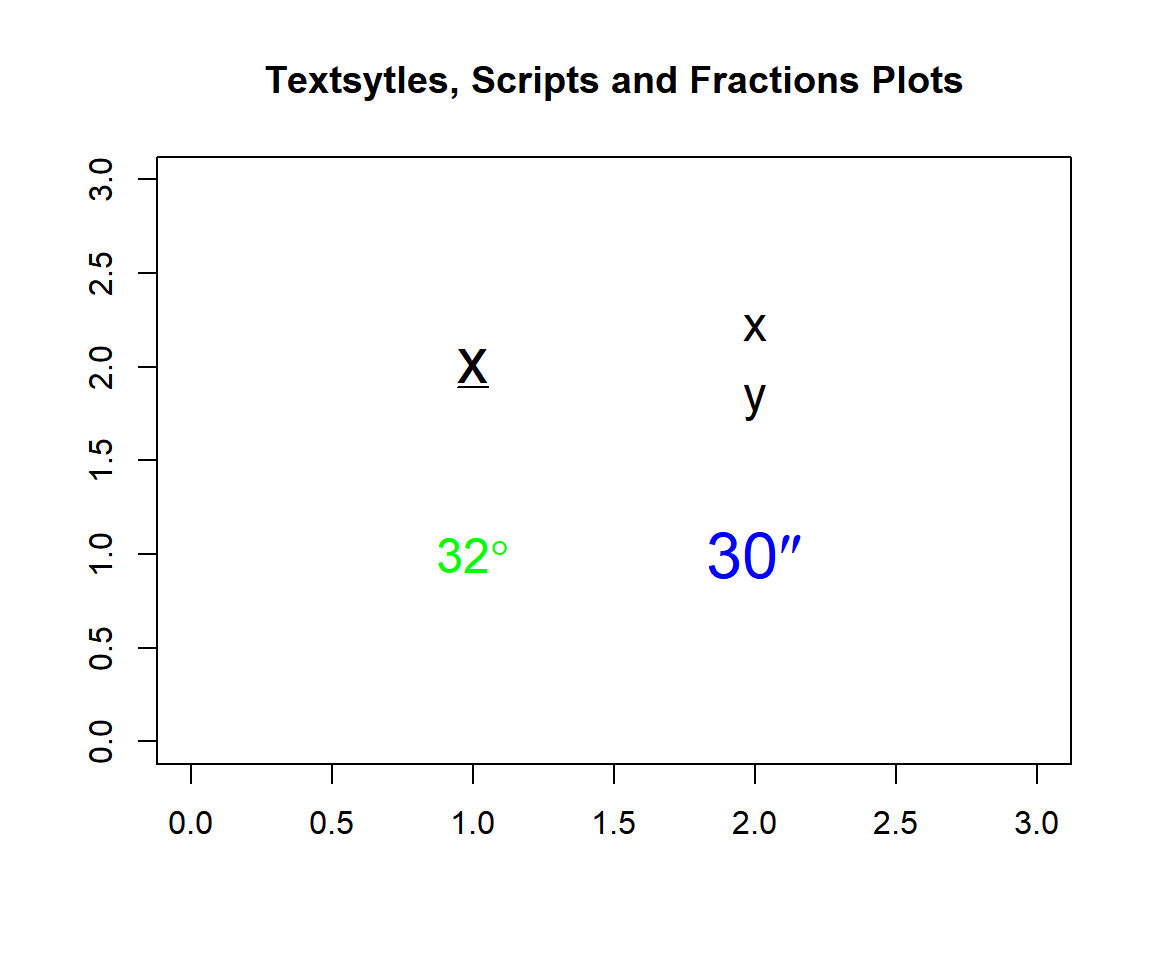
Textsytles, Scripts and Fractions on Plots in R
More examples and the inputs for textstyles, scripts, and fractions such as "bold", "italic", "bold italic", "underline", "fractions", "degrees", "minutes", "seconds", and so on, are shown below:
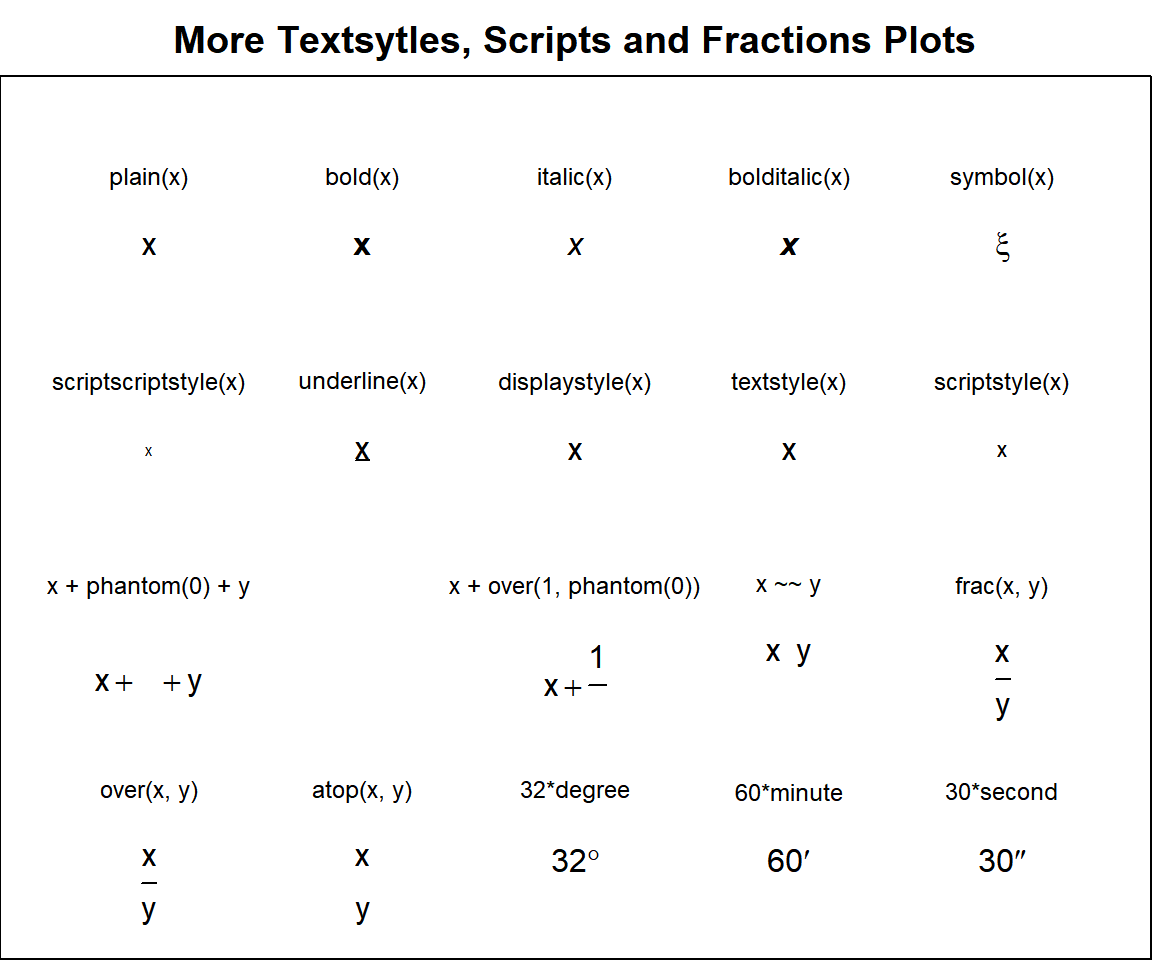
More Textsytles, Scripts and Fractions on Plots in R
The feedback form is a Google form but it does not collect any personal information.
Please click on the link below to go to the Google form.
Thank You!
Go to Feedback Form
Copyright © 2020 - 2026. All Rights Reserved by Stats Codes